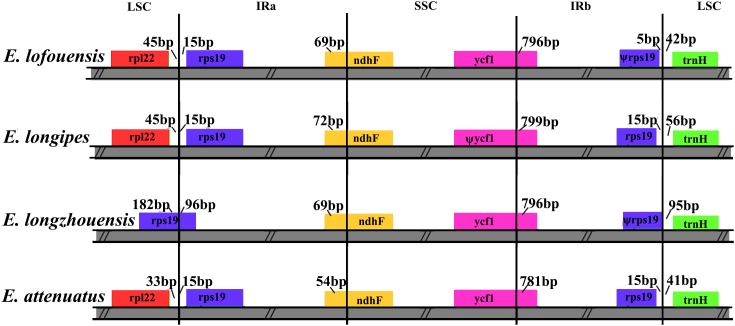
FIGURE 5.
Comparison of the LSC, IR, and SSC junction regions among four Echinacanthus chloroplast genomes. Genes are denoted by colored boxes. Ψ shows the pseudogene. The numbers above the gene features indicates the distance between the end of the gene and the borders sites. The slashes indicate the location of the distance. This figure is not to scale.

