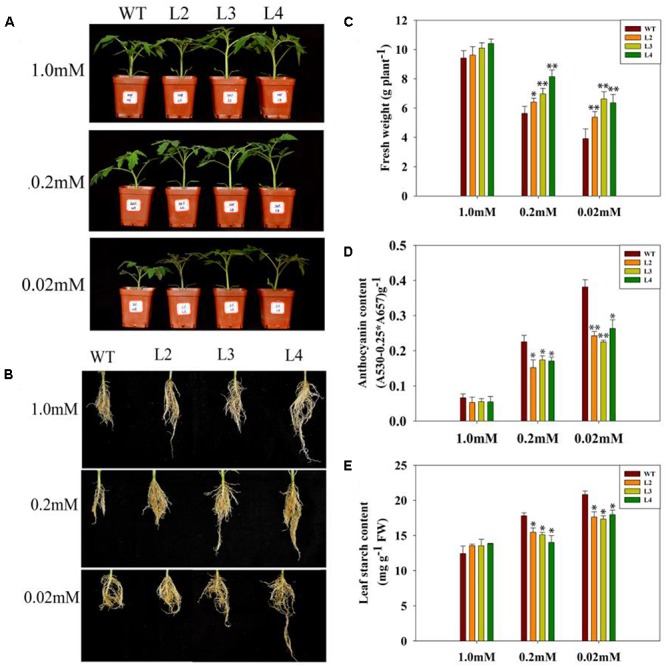
FIGURE 2.

Growth phenotype of WT and transgenic lines under variable Pi conditions. (A,B) The shoot and root phenotypes of 15-day-old WT tomato plant and three codA-transgenic tomato lines under variable Pi conditions. Seedlings (after germination) were treated with 1.0 mM phosphorus (CK), 0.2 mM phosphorus and 0.02 mM phosphorus (LP) for 15 days under sand-culture system. Then, photos were taken. (C) The whole-plant biomass of WT and transgenic lines under the various Pi concentrations as described in (A,B). 15-day-old tomato seedlings were collected for biomass analysis. Values are means ± SD. n = 12 for each genotype. (D) Anthocyanin content in the leaves of plants treated with 1.0, 0.2, 0.02 mM phosphorus for 15 days; seedlings were subsequently harvested for measuring anthocyanin content. (E) Starch accumulation of the 15-day-old WT and transgenic lines described in (D). Values represent means ± SD of three replicates. Asterisks indicate significant differences compared with WT plants (Student’s t-test). FW, fresh weight; ∗P < 0.05; ∗∗P < 0.01.
