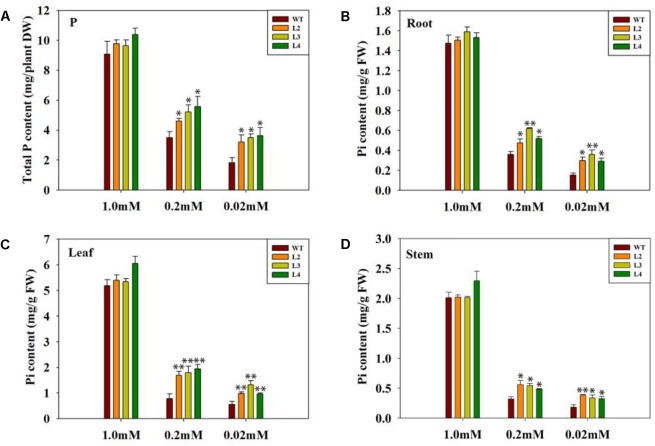
FIGURE 5.
Comparison of total P and Pi content between WT and transgenic plants. Plants were grown under variable Pi conditions for 15 days. (A) Total phosphorus content of WT and transgenic lines under different Pi concentrations. Seedlings (after germination) were treated with 1.0 mM phosphorus (CK), 0.2 mM phosphorus, and 0.02 mM phosphorus (LP) for 15 days under sand-culture system. Seedlings were subsequently harvested for measuring phosphorus content. Values are means ± SD. n = 4 for each genotype. (B–D) The Pi content of the leaves, stem and root under normal Pi and low Pi conditions. Pi content was measured in harvested 15-day-old tomato plants. Values represent the means ± SD of three replicates. Asterisks indicate significant differences compared with WT plants (Student’s t-test). DW, dry weight; FW, fresh weight; ∗P < 0.05; ∗∗P < 0.01.

