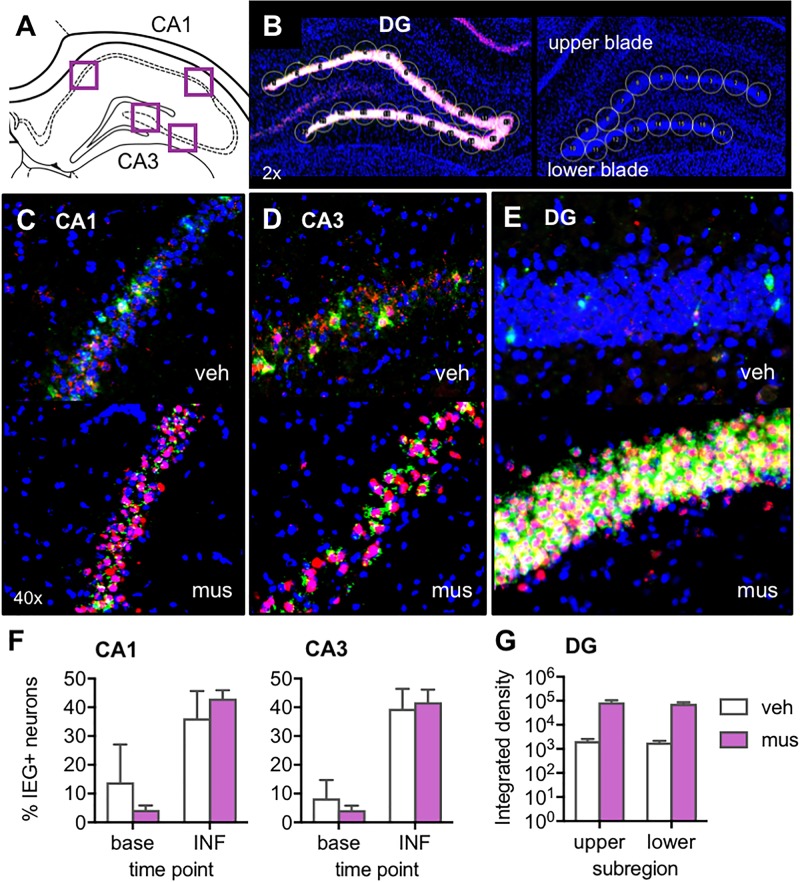
FIGURE 3.
Verification of the effect of muscimol infusions on neural activity across hippocampal subregions with fluorescence in situ hybridization (FISH) for the immediate-early genes (IEGs) Arc and Homer 1a. (A) Regions of interest from which z-stacks were captured in CA1 and CA3 for quantification of IEGs by manual counting in ImageJ. (B) Representative images from a muscimol-infused rat (left) and vehicle-infused rat (right) show schematic of cursors aligned across upper and lower blades of DG for densitometric quantification of IEGs using ImageJ software. (C–E) Representative z-stacks show Arc (fluorescein; green channel) and Homer1a (Cy3; red channel) labeling from a vehicle (veh)-infused and muscimol (mus)-infused rat; (C) CA1, (D) CA3, and (E) DG. (F) Plots show mean ± SEM percent IEG-positive DAPI-stained neuronal nuclei reflecting cells active at baseline (base), 60 min prior to sac (Homer1a cytosol), versus cells activated by the infusion (INF), 30 min prior to sac (Homer1a nuclear foci + Arc cytosol). Both infusion conditions increased percent neurons active in CA1 and CA3 relative to baseline [main effect time point: F(1,4) = 24.3, p < 0.008; no main effect infusion condition: F(1,4) = 0.39, p = 0.565]. (G) Mean ± SEM integrated density of Arc mRNA signal quantified in DG upper and lower blades. Muscimol infusion led to greater Arc expression in both DG subregions [main effect infusion condition: F(1,3) = 16.7, p < 0.027].

