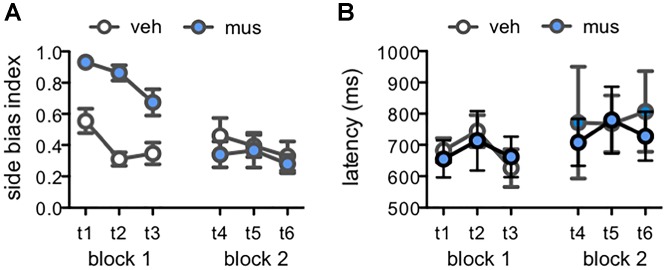
FIGURE 7.
Measures of response selection behavior in Experiment 2. Data from days with vehicle infusions (veh) designated by open circles, and on days with muscimol infusions (mus) by filled circles. Data are plotted by test day (tests 1–6; t1–t6) across each of the two test blocks. (A) Mean ± SEM side bias index values across tests. A side bias index of 1 reflects a complete bias to select the object presented on either the left or right side of the choice platform, while a side bias of 0 reflects no side bias and an equal number of responses made to the left and right sides. In block 1, side bias index values were greater after muscimol relative to vehicle [main effect infusion: F(1,15) = 33.4, p < 0.001], though decreased across tests as rats gained experience with lure objects and were increasingly able to suppress their inherent bias to correctly select the target object [main effect test: F(2,30) = 6.38, p < 0.005]. Conversely, in block 2, mean side bias index values did not differ based on infusion condition or test (p’s > 0.25). (B) Mean ± SEM response latency values for correct discrimination responses made to rats’ inherently biased side. Latencies did not differ by infusion condition [main effect infusion: F(1,9) = 0.61, p = 0.455] or across test days [main effect test: F(5,45) = 0.81, p = 0.547; infusion × test: F(5,45) = 0.21, p = 0.956].

