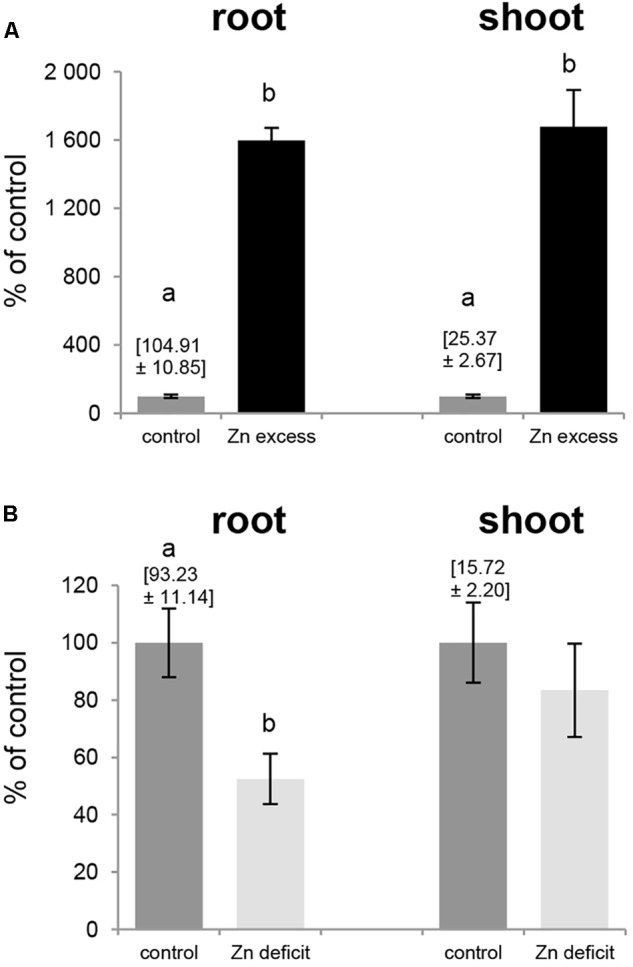
FIGURE 7.

Zinc concentration in tobacco plants. Plants were grown in the quarter-strength Knop’s medium (control) and then transferred to the control medium supplemented with 50 μM Zn for 1 day (Zn excess), or to the medium without Zn for 4 days (Zn deficit). Results are demonstrated as percent of the control values: Zn concentration at control conditions equals 100%, and at Zn excess and Zn deficit is shown as multiple of values for the control ones. Zn concentrations [mg/kg dry weight] at control conditions is given above the control bars. (A) Zn excess – 50 μM Zn; (B) Zn deficit. Values correspond to means ± SD (n = 10). Significant differences between the control plants and plants exposed to a given Zn concentration (Zn excess or Zn deficit) are marked by different letters – evaluated by Student’s t-test (P ≤ 0.05).
