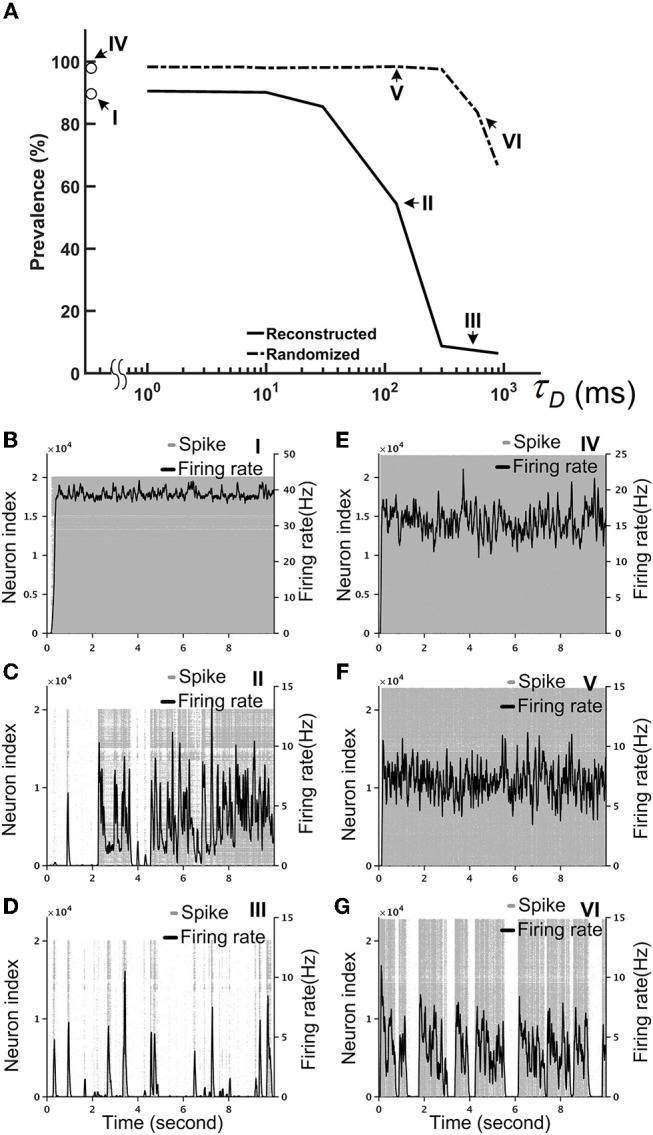
Figure 7.

Short-term depression (STD) effectively stabilized the reconstructed fruit fly brain network by suppressing hyperactivity. The I/E factor is 10 in all panels. (A) The prevalence of hyperactivity, as defined by its total duration in a 10-s simulation period, as a function of the time constant of STD. A large time constant indicates stronger STD, which dramatically reduces the prevalence of hyperactivity for the reconstructed brain, but not for the randomized brain. (B–D) The spike rastergrams (gray dots) and the averaged firing rates (black curves) of the reconstructed fly brain without STD, with τD = 125 ms, and with τD = 600 ms, respectively. (E–G) Same as in (B–D), but for the randomized brain. The activity displayed in panels (B–G) corresponds to the data points labeled by the roman numerals I–VI in the panel (A), respectively.
