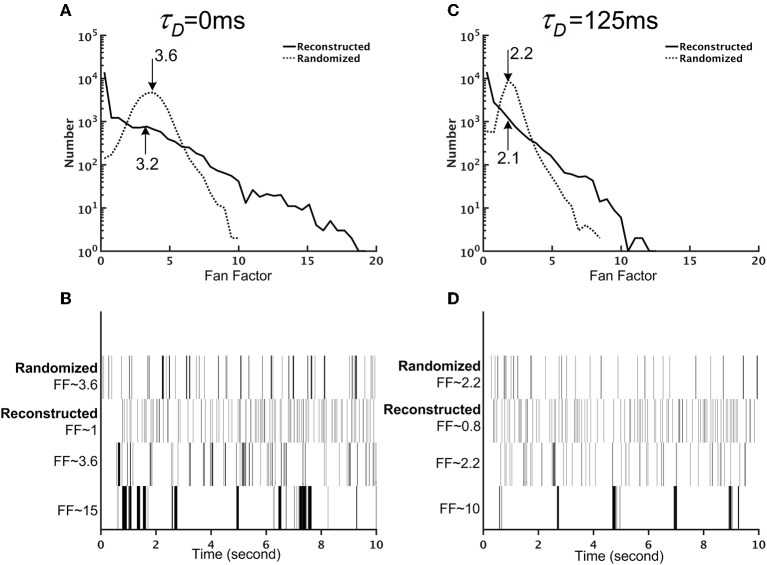
Figure 9.
The reconstructed brain network exhibits firing patterns that are more diverse than those of the randomized brain network. (A) The distribution of the Fano factors for the reconstructed (solid line) and randomized (dotted line) brain networks without short-term depression (STD) (τD = 0 ms). The arrows and the numbers indicate the mean of each distribution. Although both networks have comparable mean Fano factors, the reconstructed brain is characterized by a much wider distribution than the randomized one. (B) Sample spike trains with different Fano factors from the randomized and the reconstructed brain networks without STD (τD = 0 ms). Neurons with high Fano factors in the reconstructed brain are characterized by clusters of bursting activity, while neurons with low Fano factors have a more evenly distributed spike activity. (C) Same as in (A) but with strong STD (τD = 125 ms). (D) Same as in (B) but with strong STD (τD = 125 ms).

