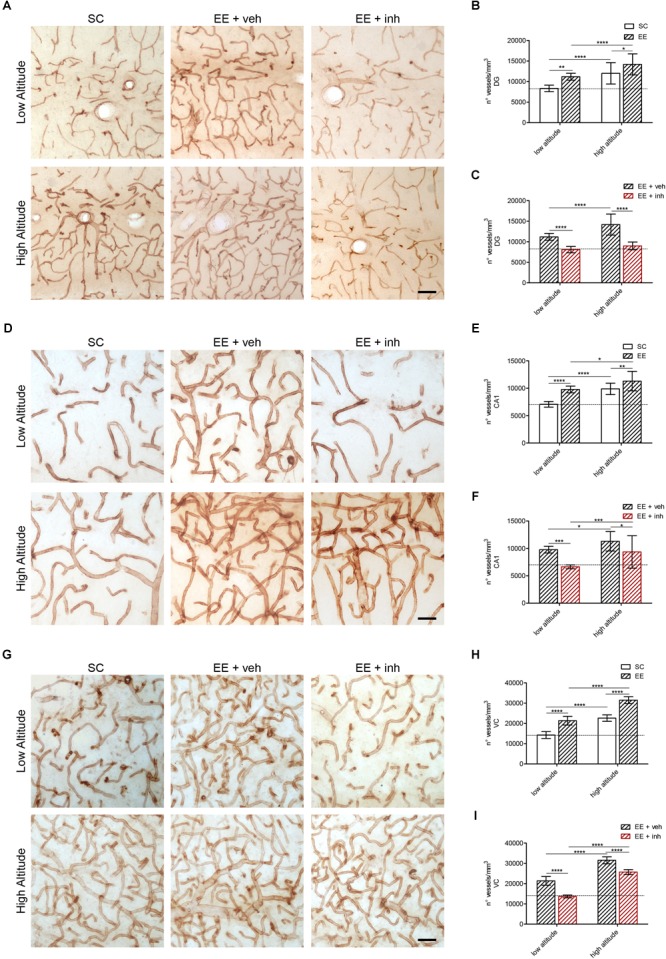
FIGURE 4.

Microvascular changes caused by enriched environment, and the inhibitor of VEGF signaling in DG, cornu ammonis (CA1) hippocampus and VC of rats exposed to high altitude. (A) Representative images of vessels stained with butyrylcholinesterase (BChE) in the hippocampus DG area of rats exposed to low (upper panel) or high altitude (lower panel) under SC and in enriched environment receiving either sucrose (EE + veh) or the inhibitor of VEGF signaling (EE + inh). (B,C) Blood vessel densities in the DG area of low- and high-altitude exposed rats kept in standard conditions (SC, white bar) or in enriched environment (EE, patterned bar) (B) as well as in enriched environment receiving either sucrose (EE + veh, black patterned bar) or the inhibitor of VEGF signaling (EE + inh, red patterned bar) (C). (D) Representative images of vessels stained with butyrylcholinesterase (BChE) in the hippocampus cornu ammonis (CA1) area of rats exposed to low (upper panel) or high altitude (lower panel) under SC and in enriched environment receiving either sucrose (EE + veh) or the inhibitor of VEGF signaling (EE + inh). (E,F) Blood vessel densities in the cornu ammonis (CA1) area of low- and high-altitude exposed rats kept in standard conditions (SC, white bar) or in enriched environment (EE, patterned bar) (E) as well as in enriched environment receiving either sucrose (EE + veh, black patterned bar) or the inhibitor of VEGF signaling (EE + inh, red patterned bar) (F). (G) Representative images of vessels stained with BChE in the layer 4 VC of rats exposed to low (upper panel) or high altitude (lower panel) under SC and in enriched environment receiving either sucrose (EE + veh) or the inhibitor of VEGF signaling (EE + inh). (H,I) Blood vessel densities in the layer 4 VC of low and high altitude exposed rats kept in standard conditions (SC, white bar) or in enriched environment (EE, patterned bar) (H) as well as in enriched environment receiving either sucrose (EE + veh, black patterned bar) or the inhibitor of VEGF signaling (EE + inh, red patterned bar) (I). Scale bar (A,D,G): 50 mm. Statistics (B,C,E,F,H,I): 2-way ANOVA (∗∗∗∗P < 0.0001, ∗∗∗P < 0.001, ∗∗P < 0.01, ∗P < 0.05) with n = 12; error bars indicate SD.
