Fig. 2.
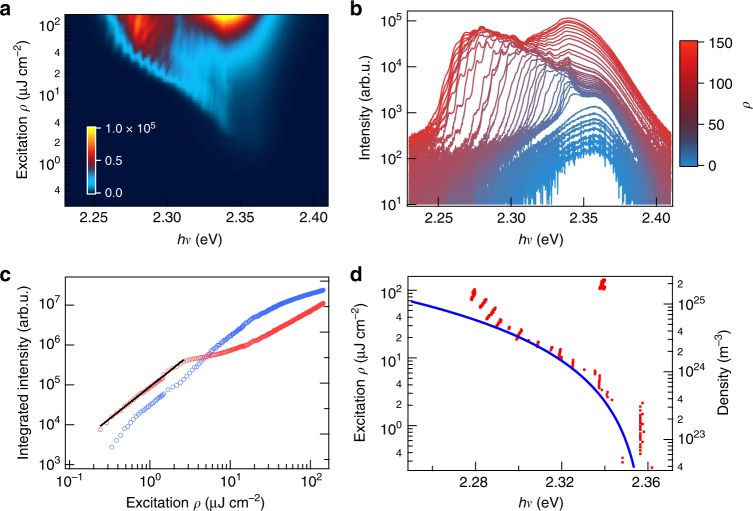
Excitation density-dependent lasing spectra revealing lasing and saturation thresholds. Two-dimensional pseudo-color plot (a) and horizontal cuts (b) of photoluminescence spectra as a function of increasing excitation energy density (ρ), 0.24–145 µJ cm−2. The excitation energy density in (b) increases from blue to red (0.43, 0.53, 0.62, 0.77, 1.0, 1.1, 1.3, 1.5, 2.4, 2.6, 2.9, 3.1, 3.6, 4.3, 5.3, 6.5, 7.2, 7.9, 8.6, 9.6, 11.0, 12.5, 13.9, 15.4, 17.3, 19.7, 21.6, 24.0, 33.1, 37.9, 49.9, 61.9, 71.5, 83.5, 95.5, 107.5, 119.5, 131.5, 144.0 µJ cm−2). Note the logarithmic scale for emission intensity in (b). These spectra show the evolution of emission from below the lasing threshold (3 μJ cm−2) through the lasing saturation threshold (30 μJ cm−2) and above. Stimulated behavior is confirmed from the PL intensity as a function of excitation density (c), showing the integrated intensity in the lasing spectral region (blue) where the onset of lasing corresponds to superlinear behavior and saturation of the PL intensity (red). An exponential fit (black line) represents the power scaling law of ρ1.5 present below the lasing threshold. As pump fluence increases, the lasing spectral density red-shifts, as shown by the positions (red dots) of the most intense peak in lasing/PL spectra as a function of excitation density (d). The blue curve in (d) shows fit to the excitation density-dependent plasmon energy. All spectra were obtained from a single NW with 15 µm length at a substrate temperature of 80 K

