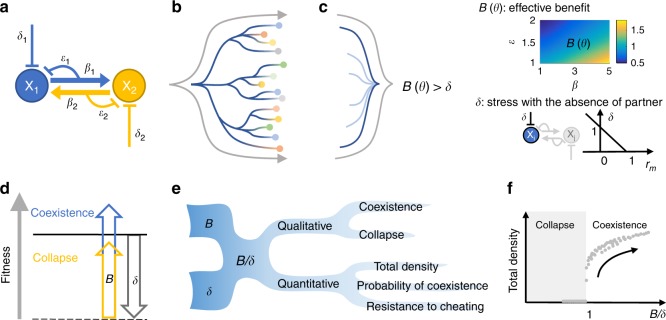
Fig. 1.
B and δ are two driving forces that determine qualitative and quantitative mutualistic outcomes. a The basic logic of mutualistic systems. The two partner populations are denoted by X1 and X2. β1 and β2 describe the level of benefit. ε1 and ε2 describe the cooperation cost of providing benefit. The two populations also experience stress δ1 and δ2. b Models originating from the basic logic of mutualism yield diverse coexistence criteria. Each line represents the generation of a model from the basic mutualism logic and branching represents different implementation details and system complexities. The circles represent the models and diverse coexistence criteria derived from these models. This process aims to reflect the diversity of mutualistic systems in nature. c A simple rule emerges at an appropriate level of abstraction. The lines represent the abstraction process that establishes B(θ) > δ as the common structure shared by diverse models in panel b. B(θ) represents effective benefit and is a complex function of model parameters θ, which include β and ε. B increases with increasing β and decreasing ε. The heatmap is generated using Eq. (4). δ is the stress experienced by one population. rm is growth rate measurement. Note that the color bar is dimensionless, and it is the same for all following color bars. d Intuitive interpretation of the simple rule. The effective benefit B must overcome stress δ for the system to coexist. Solid black line represents coexistence boundary and dashed black line represents baseline fitness level with the absence of partner. Blue represents a B that is greater than δ (coexistence) and yellow represents a B that is smaller than δ (collapse). e B/δ can predict various system outcomes. If the two features B and δ are known, many downstream predictions, both qualitative and quantitative, can be made. f Quantitative outcomes versus B/δ. Simulation results show when B/δ > 1, it is predictive of total density. Note that the points do not necessarily lie on a single curve, but a positive trend is well-maintained. Other quantitative outcomes also follow similar positive trends when plotted against B/δ

