Fig. 2.
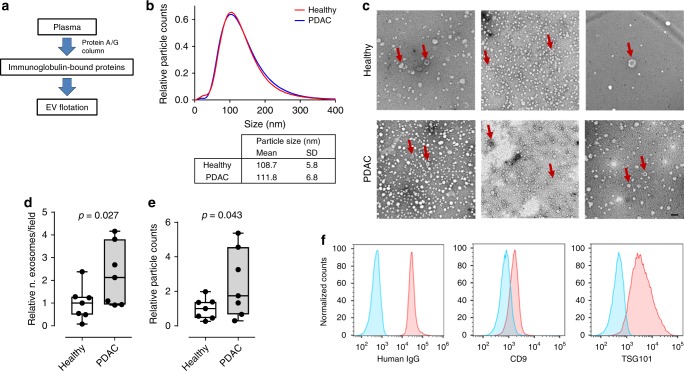
Characterization of exosomes bound to circulating immunoglobulins. a Schematic of the work-flow used for the isolation of exosomes present in the plasma Ig-bound fraction from PDAC patients and healthy controls (n = 7 per group). b Nanoparticle-tracking analysis of exosomes isolated from the plasma Ig-bound fraction indicating average size distribution of particles in PDAC and healthy control samples. Individual sample size distribution is shown in Supplementary Figure 2. c Representative TEM micrograph of exosomes isolated from the plasma Ig-bound fraction of PDAC patients and healthy controls. Arrows indicate vesicles with classical exosome size and morphology. Scale bars: 100 nm. d The relative number of exosomes per field (n = 3) analyzed by TEM. e The relative number of exosomes (30–200 nm size) in the Ig-bound fraction relative to the total number of exosomes in the neat plasma as quantified by nanoparticle-tracking (n = 3). Boxes in both graphs indicate 25th and 75th percentiles, and horizontal lines inside the boxes indicate median. Bars indicate 10th and 90th percentiles. Data were standardized based on the average of healthy controls. p-value was calculated by one-sided unpaired t-test. f Flow-cytometry analysis using anti-human IgG, CD63, and TSG101 of exosomes isolated from the plasma Ig-bound fraction and coupled to 0.4 μm-diameter beads. The graphs show representative analysis of a PDAC patient sample

