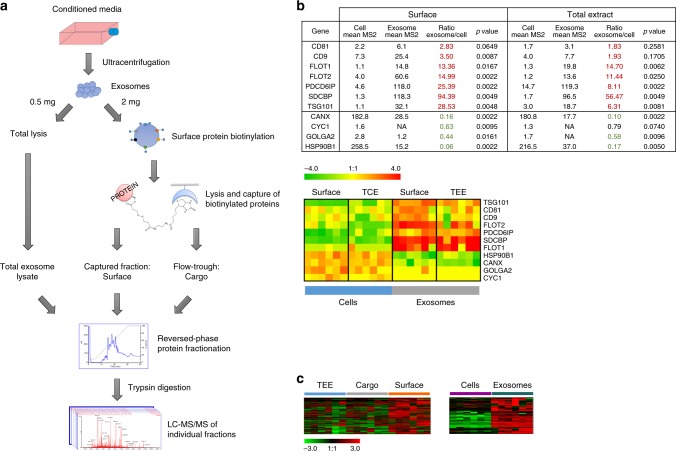
Fig. 4.
Proteomic profiling of PDAC cell line exosomes. a Schematic of the work-flow used for the proteomic analysis of PDAC cell line exosomes. Exosome surface proteins were obtained by labeling proteins on the outside of the vesicles with a biotinylated tag and then capturing these proteins by affinity chromatography. Proteins not bound to the column (flow through) were named as cargo proteins. In parallel with the total extract, these two sets of proteins were fractionated (by reversed-phase chromatography) and individual fractions subjected to tryptic digestion followed by LC-MS/MS, for protein identification. b Table and heatmap showing the average spectral abundance (MS2 counts) of exosome markers and endosomal proteins in total lysate and surface proteome of PDAC cells and exosomes. p-value was calculated by Mann–Whitney t-test. c Heatmaps depicting the cluster on proteins identified to be enriched (left panel) in the exosome surfaceome (orange bar) relative to total exosome extract (blue bar) and cargo compartments (gray bar) or on the exosome surface compared to cell surface (right panel). Heatmaps were generated through complete linkage hierarchical clustering of proteomics data (normalized MS2 counts); Pearson correlation was applied as the basis for distance measure. TCE total cell extract, TEE total exosome extract

