Fig. 6.
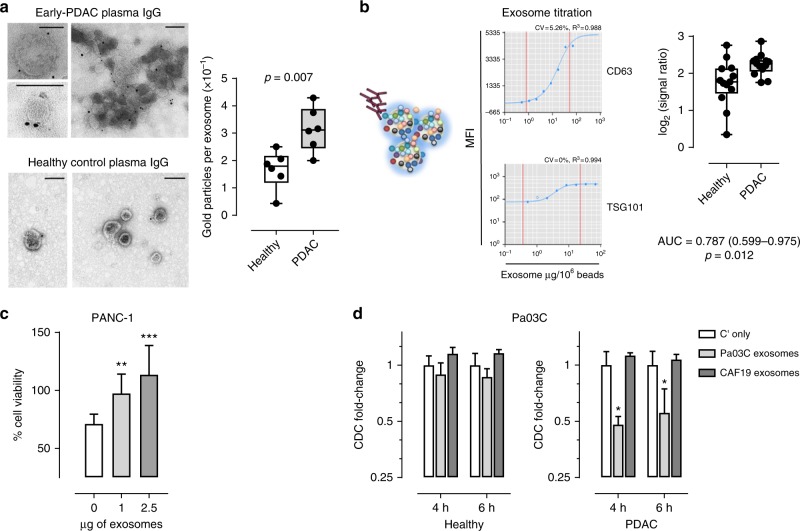
Binding of PDAC patient autoantibodies to PDAC cell exosomes. a Representative TEM micrograph of the immunogold labeling of exosomes isolated from PDAC cell lines using IgGs affinity-purified from early-stage PDAC (pool, n = 10) and matched healthy subject control (pool, n = 10) plasmas. Black dots indicate gold immunolabeling. Scale bars: 100 nm. Graph represents the average number of gold particles per exosome in each field analyzed by TEM (n = 6). Boxes indicate 25th and 75th percentiles; horizontal lines indicate median. Bars are 10th and 90th percentiles. p-value was calculated by unpaired t-test. b Luminex assay of PDAC patient autoantibody reactivity against PDAC cell-derived exosomes. An equal number of exosomes isolated from the panel of 6 PDAC cell lines were combined and coupled to Luminex microspheres at optimal concentration established using anti-CD63 and TSG101 antibodies after exosome titration (left panels). Graph showing autoantibody reactivity of PDAC and matched healthy subject serum samples from the CARET cohort (n = 13 per group) against PDAC cell line-derived exosomes coupled to Luminex beads (right panel). Boxes indicate 25th and 75th percentiles; horizontal lines inside the boxes indicate median. Bars are 10th and 90th percentiles. p-value calculated by Mann–Whitney t-test (n = 3). c Complement-dependent cytotoxicity of PANC-1 cells, in presence or absence of increasing amount of PANC-1 exosomes, mediated by pre-diagnostic PDAC sera from the CARET study (pool, n = 13). Graphs illustrate the mean result of three independent experiments ± SD. d Complement-dependent cytotoxicity of Pa03C cells, in presence of Pa03C or CAF19 exosomes, mediated by pre-diagnostic PDAC sera or matched healthy controls from the CARET study (pool, n = 13). Experiments were performed by live cell imaging cytotoxicity analysis. Data are expressed as fold change in the number of green (dead) cells relative to the respective controls (sera plus complement in absence of exosomes; Cʹ only) at two different time points after complement incubation. Graphs illustrate the mean result ± SD of triplicates from a representative experiment of three replicates. p-values calculated by unpaired t-test: *p < 0.05, **p < 0.01 and ***p < 0.001. AUC area under the curve

