Figure 1.

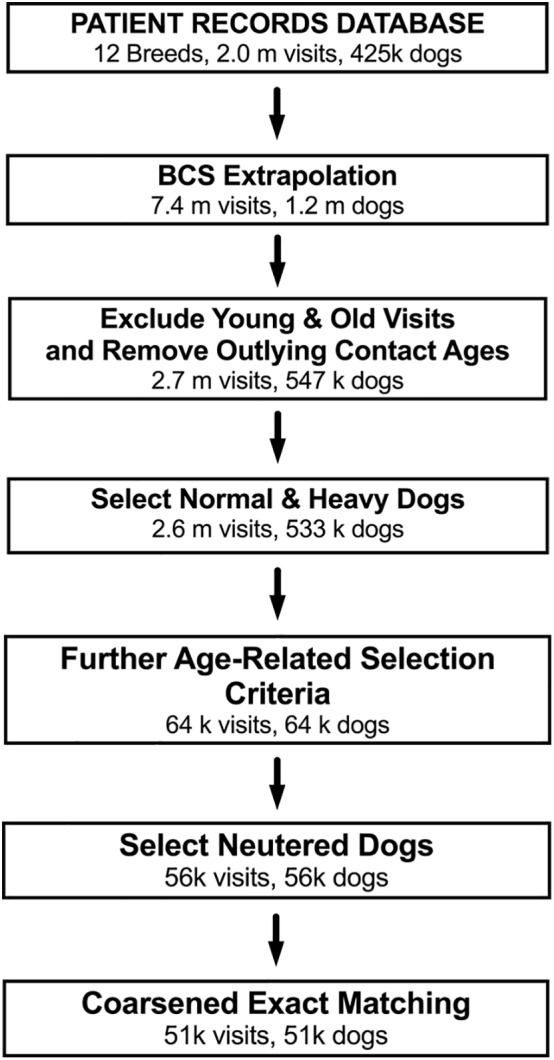
Summary of the data cleaning process. Flow diagram illustrating the data cleaning process to create the final study population. The number of dogs eligible at each stage is depicted, where m denotes million(s) and k denotes thousand(s)

Summary of the data cleaning process. Flow diagram illustrating the data cleaning process to create the final study population. The number of dogs eligible at each stage is depicted, where m denotes million(s) and k denotes thousand(s)