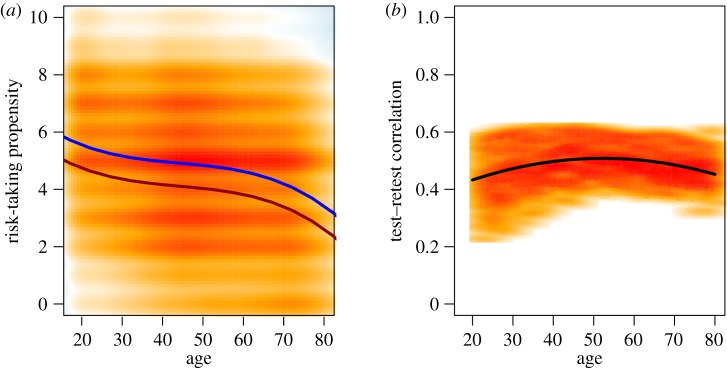
Figure 3.
Change and stability in risk preference. The effect of age on (a) cross-sectional mean-level change (‘Are you generally a person who is willing to take risks or do you try to avoid taking risks? Please tick a box on the scale, where the value 0 means not at all willing to take risks and the value 10 means very willing to take risks’), and (b) temporal stability of self-reported risk preference. In (a), the two lines represent the results for males (upper) and females (lower), respectively. All data stem from the German socio-economic panel and are plotted on a kernel density plot in which darker shades indicate a higher density of responses. In (b), the black line represents the weighted average from test–retest correlations between all pairs of measurement waves for males and females combined. Adapted from [38].

