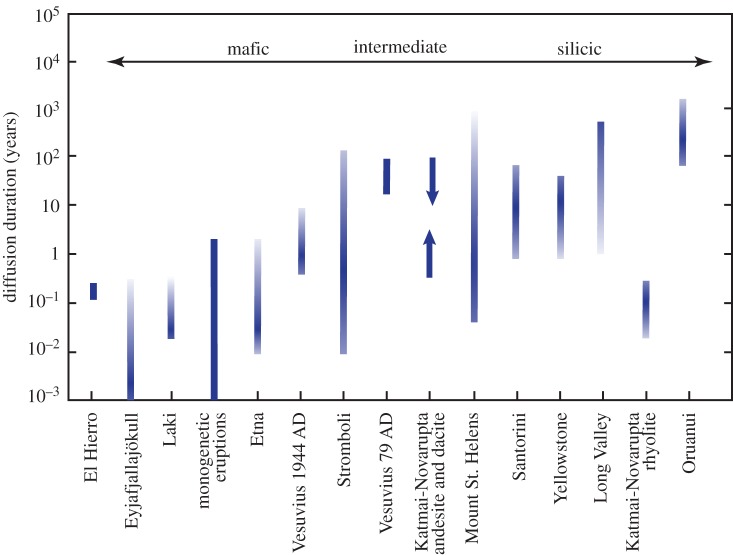
Figure 1.
Examples of mixing-to-eruption or magma assembly times derived from modelling diffusion equilibration in volcanic crystals. Note that this diagram is a sampling of recent work (weighted towards recent examples) rather than a comprehensive review. Each bar represents a range of modelled diffusion times, with intensity of colour schematically indicating the number of data in that time interval. Bars are solid colour where only a few data exist, and have arrows pointing up or down for minimum and maximum diffusion durations, respectively. Arrow across the top of the diagram schematically indicates magma composition, with mafic eruptions to the left and more silicic eruptions towards the right. The volcanic systems studied are listed along the bottom axis. Data from the following sources: El Hierro, Canary Islands [33]; Vesuvius 1944 AD [34]; Vesuvius 79 AD [35]; Eyjafjallajökull [36]; Laki [37]; monogenetic eruptions [38]; Etna [30,39–41]; Stromboli [24,28]; Katmai-Novarupta [42]; Mount St. Helens [43]; Santorini [44]; Bishop Tuff, Long Valley [27]; Yellowstone [26]; Oruanui, New Zealand [45]. (Online version in colour.)

