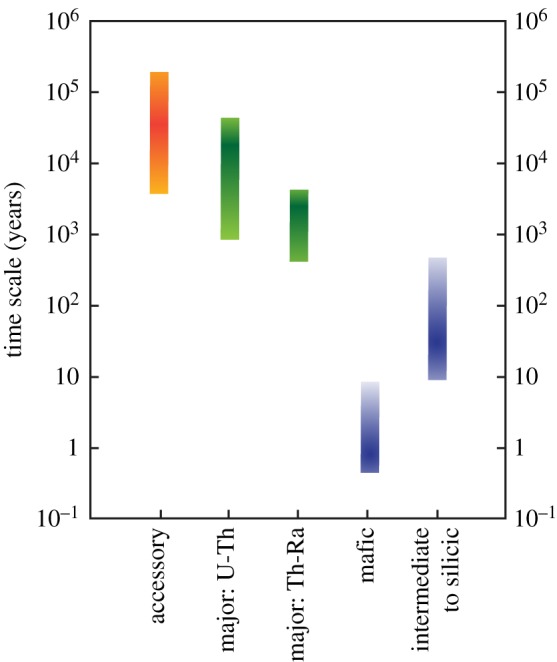
Figure 2.

Schematic diagram summarizing time scales from crystal records. Crystallization ages or diffusion durations are plotted according to the technique, crystal, and/or magma composition. Coloured bars show crystal ages or diffusion durations, with colour intensity schematically indicating data density. However, note that the complete compilations for both crystal ages and diffusion data have some longer and shorter times (see [13] for complete crystal age compilation); the bars shown here represent the dominant populations (e.g. main peaks on probability density distributions). U-series or U-Pb crystallization ages from accessory phases (mostly zircon) are shown in orange, U-Th-Ra major phase crystallization ages in green (separated by parent–daughter pair). Diffusion data shown in blue represent a broad summary of the data shown in figure 1. (Online version in colour.)
