Figure 3.
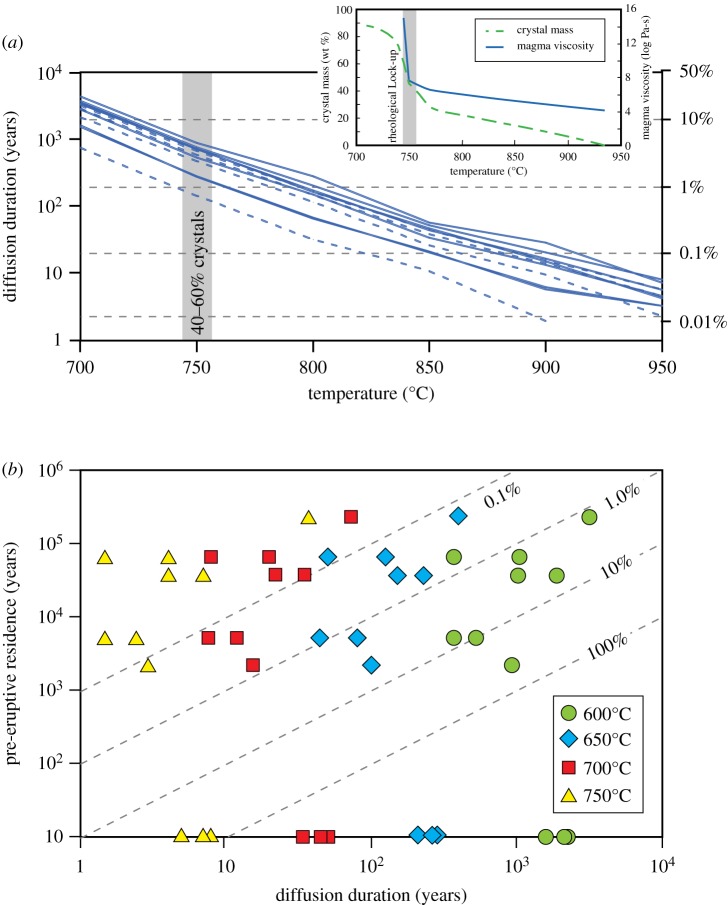
Examples of data used to provide constraints on thermal conditions of crystal storage. (a) Modelled durations of diffusion of Sr in plagioclase from Mount Hood (modified from [19]) as a function of model temperature. Solid and dashed blue lines represent profiles across individual crystals for two different samples. Secondary vertical axis and dashed lines show the model diffusion durations as a percentage of the minimum average crystallization age for plagioclase (approx. 21 ka; [19]). Inset shows the relationship between temperature, crystal mass, and magma viscosity from R-MELTS simulations for the Mount Hood magma composition. (b) Comparison of minimum pre-eruptive residence of zircon crystals with modelled diffusion durations for the same zones within the crystals. In the case of three peaks from two crystals, minimum ages were within error of eruption age; diffusion time scales for these are shown along the x-axis. Diffusion time scales for each peak are shown at modelled temperatures of 600°C (green circles), 650°C (blue diamonds), 700°C (red squares), and 750°C (yellow triangles). Diagram is contoured for the percentage of the pre-eruptive residence time that is represented by the diffusion time scales (dashed lines labelled with percentages). Diagram modified from [22].

