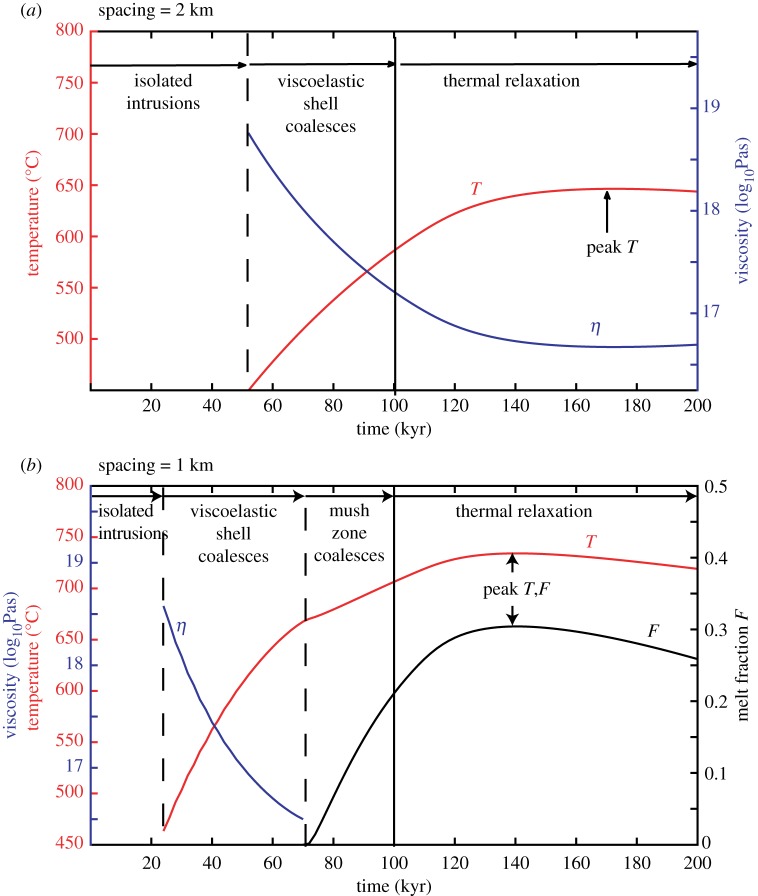
Figure 6.
Example of simulation for intrusions growing from 8 to 13 km depth over 100 kyr showing the evolution of the peak temperature, viscosity and melt fraction mid-way between intrusions. The dashed lines mark the first change in temperature and the appearance of melt and the plain line the last magma injection. The viscosity computation is only valid before melt appearance. (a) For a spacing of 2 km in which no melt appears, and (b) for a spacing of 1 km, where melt appears on the boundary approximately 70 kyr after the start of injection. (Online version in colour.)

