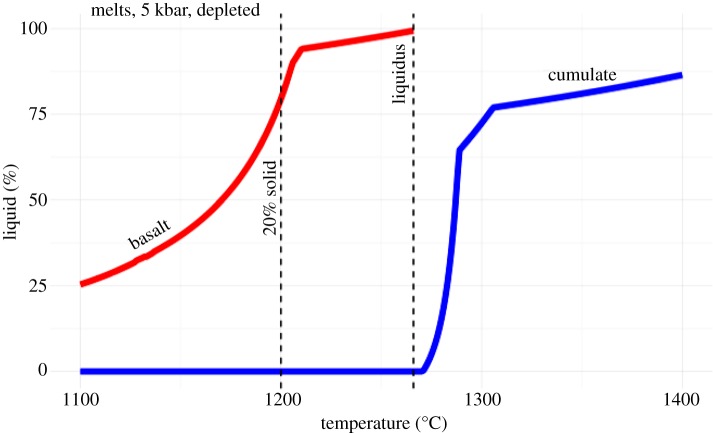
Figure 5.
Results of MELTS calculations based roughly on the behaviour of expected Borgarhraun parental melt. The red curve (basalt) shows the melt fraction against temperature relationship for this melt during fractional crysallization. The blue curve (cumulate) shows the melting behaviour of a composition that corresponds to that of the solids generated during the first 20% of crystallization of the parental melt. This composition is solid at the liquidus temperature of the incoming primary melt. (Online version in colour.)

