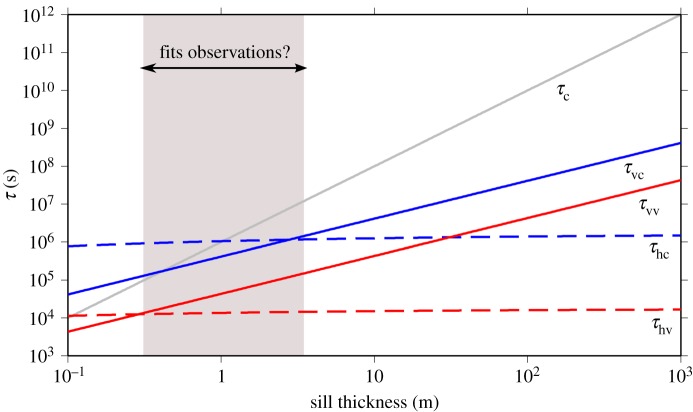
Figure 7.
Characteristic time scales for cooling and mixing in a melt layer. The grey line is the conductive cooling time scale (τc). The blue solid line is the convective cooling time scale in the case where heat loss from the sill is controlled by the thermal gradient in the country rock (τvc). The red solid line is the convective cooling time scale for when the heat loss is controlled by the temperature-dependence of the viscosity of the melt (τvv). The dashed lines show the chemical homogenization time scales associated with these two convective cooling time scales. The grey shaded box shows the range of sill thicknesses that approximately match the observations. (Online version in colour.)

