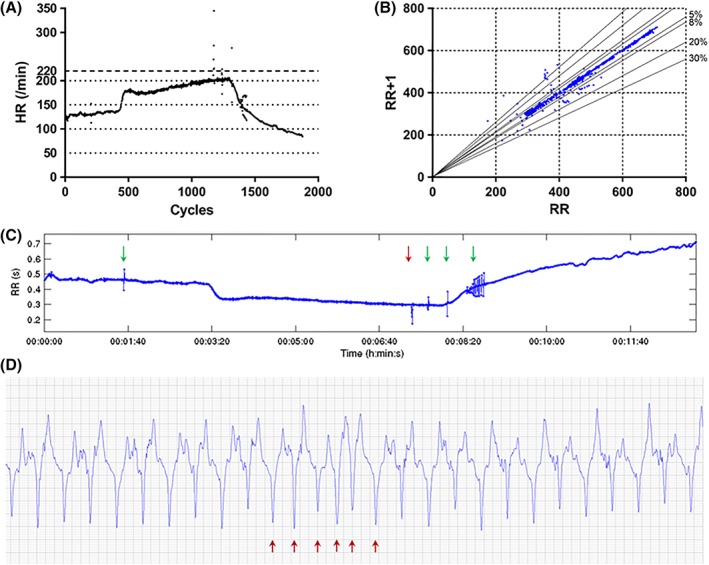
Figure 1.

(A) HR tachogram of a horse from Group A, where premature beats are observed as outliers during the exercise test. (B) Poincaré plot of the same study horse. Outliers represent premature beats and related pauses. Solid lines represent 5, 8, 20, and 30% R‐R deviation; (C) R‐R time series of the exercise test as exported from the HRV analysis software (Kubios HRV analysis software, Finland), showing premature beats and subsequent pauses as peaks. The red arrow indicates the run of NST during canter (shown in D), the green arrows indicate VPCs seen during the trot, canter and recovery phases; (D) ECG recording of the short run of NST (indicated by the red arrows), including “near R‐on‐T,” during canter. Abbreviations: ECG, electrocardiograph; HR, heart rate; HRV, heart rate variability; NST, non‐sinus tachycardia; VPCs, ventricular premature complexes
