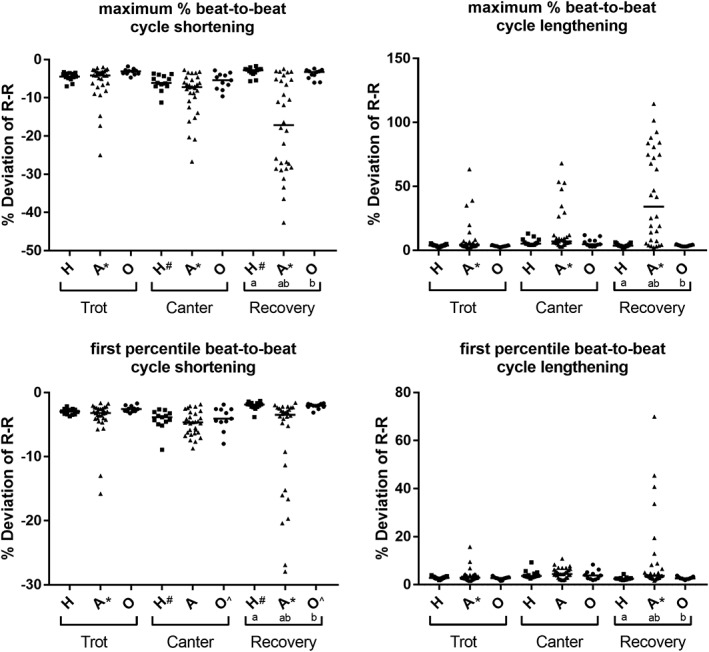
Figure 2.

Dot plots of the maximum % R‐R shortening and lengthening and of the 1st percentile % R‐R shortening and lengthening, respectively. The solid line represents the median. Groups (a,b) or phases (#,*,^) that are significantly different (P < .05) from one another are indicated with the same superscript. Abbreviations: H, Group “healthy”; A, Group “arrhythmia”; O, Group “other”
