Figure 2.

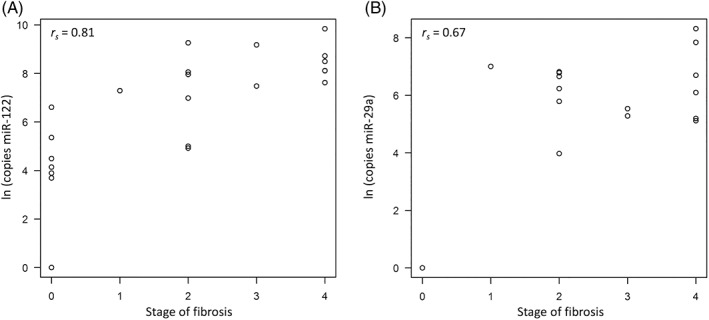
Scatter plot with Spearman correlation coefficient (rs) of circulating miR‐122 (A) and miR‐29a (B) concentrations with the stage of fibrosis in Labrador Retrievers

Scatter plot with Spearman correlation coefficient (rs) of circulating miR‐122 (A) and miR‐29a (B) concentrations with the stage of fibrosis in Labrador Retrievers