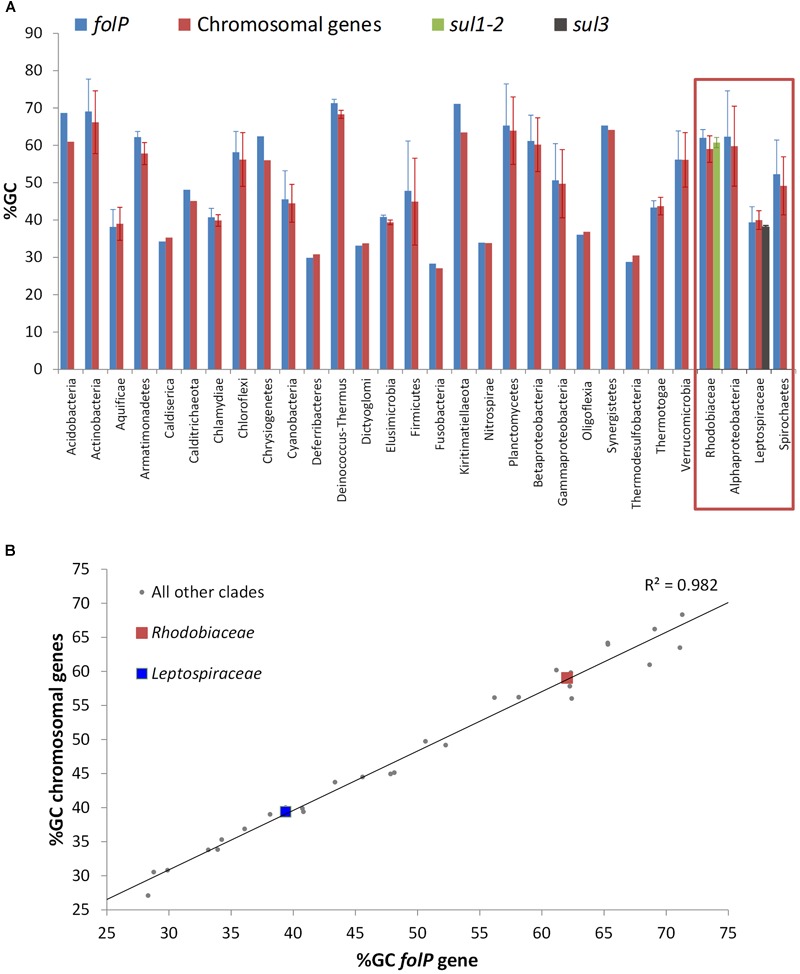
FIGURE 4.

(A) %GC content of folP and all other chromosomal coding sequences in different clades. The %GC content of sul1/2 and sul3 genes is shown adjacent to that of the Rhodobiaceae and the Leptospiraceae. (B) Correlation between the %GC content of folP genes and that of all other coding sequences in their respective genomes. The data points corresponding to folP∗ genes from the Rhodobiaceae and the Leptospiraceae are shown as squares.
