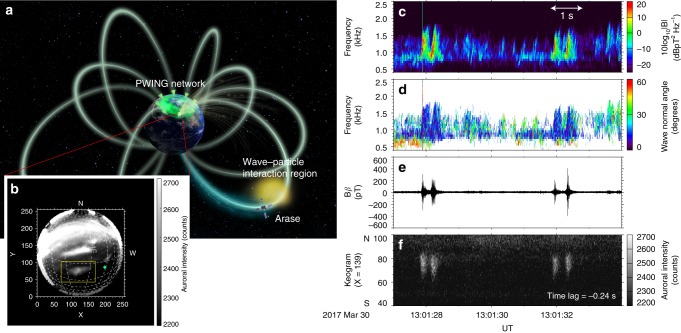
Fig. 1.
Coordinated PWING stations and Arase observations. a Illustration of conjugate observations from the PWING ground network and the Arase satellite. Earth in Fig. 1a is mapped using NASA image. All rights reserved. b All-sky EMCCD snapshot observed at Gakona in Alaska at 13:01:28 UT, 30 March 2017. Dotted lines indicate the spacing of geographical latitudes and longitudes at 1° and 2° intervals. The yellow frame indicates the auroral region that is focused on in this study. The green diamond symbol indicates Arase’s footprint at the time of observation. c–e The dynamic spectrum, wave-normal angle with respect to the geomagnetic field line, and the waveform of large-amplitude chorus elements observed by Arase near the magnetic equator. f North to South keogram of auroral emissions with a time shift of −0.24 s

