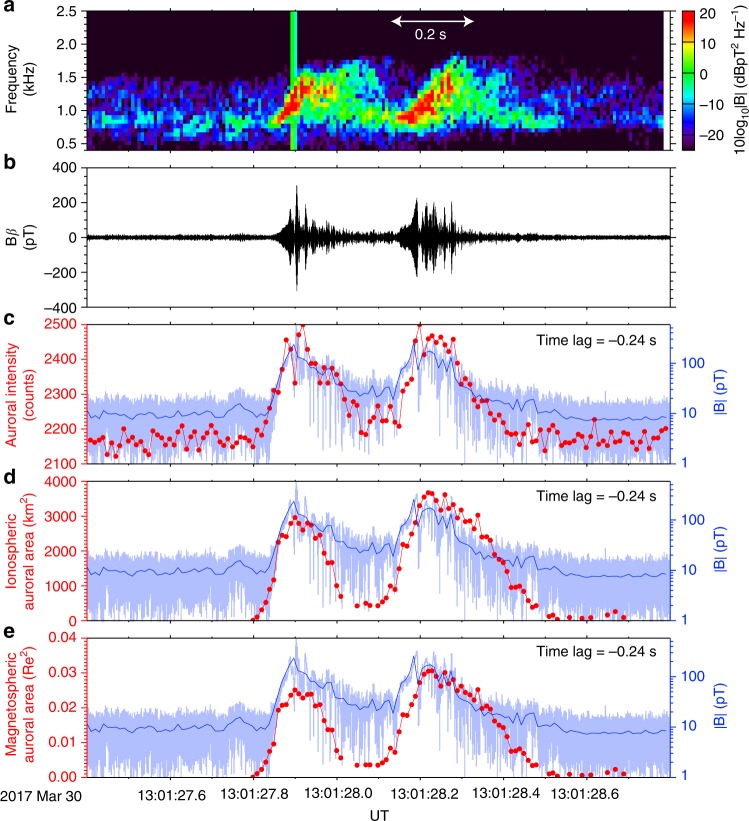
Fig. 6.
Evolution of chorus element wave–particle interactions associated with the chorus-wave growth. a, b The frequency–time diagram and the waveform of discrete chorus elements. c The temporal evolution of the auroral emissions. Spatial evolutions of the auroral area d in the ionosphere (110 km) and e at the magnetic equator. The light and rich blue curves indicate chorus amplitudes with a temporal resolution of 1/65536 s and an averaged resolution of 1/100 s in panels c, d, and e

