Fig. 4.
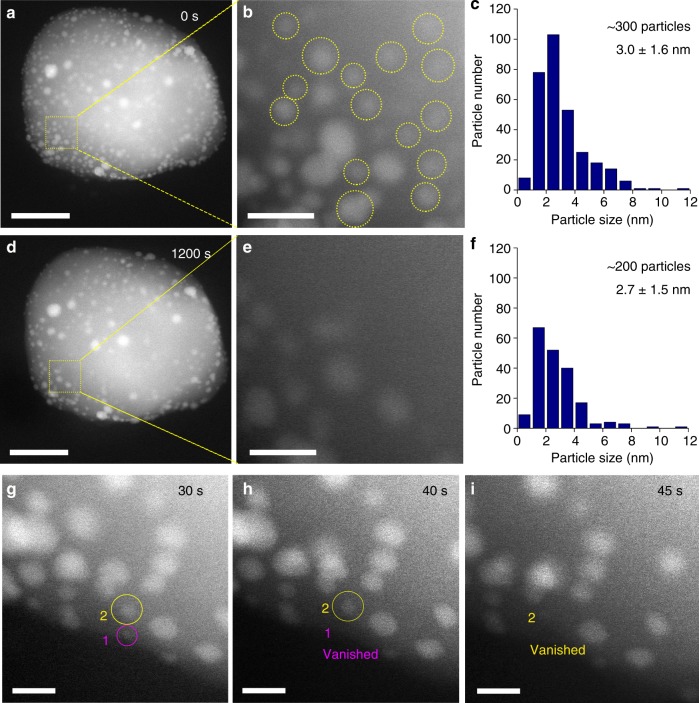
In situ characterization of Pt NP oxidative dispersion. a–c HAADF-STEM images and size distribution histogram of 1Pt/Fe2O3-NP before, and d–f after in situ calcination at 800 °C under 1 bar flowing O2 for 20 min: the yellow squares in panels a and d show the same sample area. A 50 nm scale bars in a, d and 10 nm scale bars in b, e. Yellow circles in panel b highlighted the particles missing after calcination for 20 min. g–i Sequential HAADF-STEM images from the same area showing the dissociation of small particles (labeled by purple and yellow circles) during in situ calcination: 5 nm scale bars; elapsed time (in seconds) indicated in upper right corner of each image

