Fig. 5.
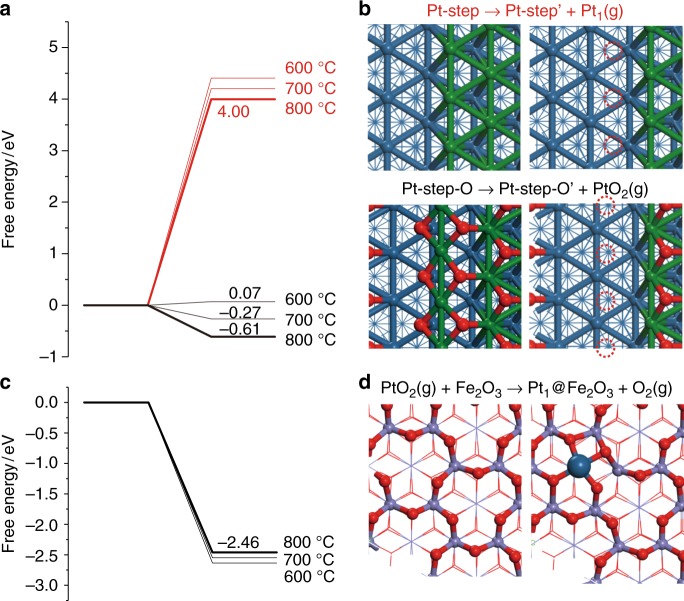
Optimized structures and energy profiles for Pt NP dispersion as isolated Pt atoms. a, b Calculated energies and surface structures for evaporation of a single Pt atom (Pt1) from a Pt(221) step (red value) or evaporation of a PtO2 species from an oxygen pre-covered Pt(221) step (black values). c, d Calculated energies and surface structures for dissociative capture of PtO2 over Fe2O3(0001) surface and concomitant formation of a Pt1 atom and evolved O2. Color code: outermost layer Pt (green); second layer Pt (blue); O (red); Fe (purple)

