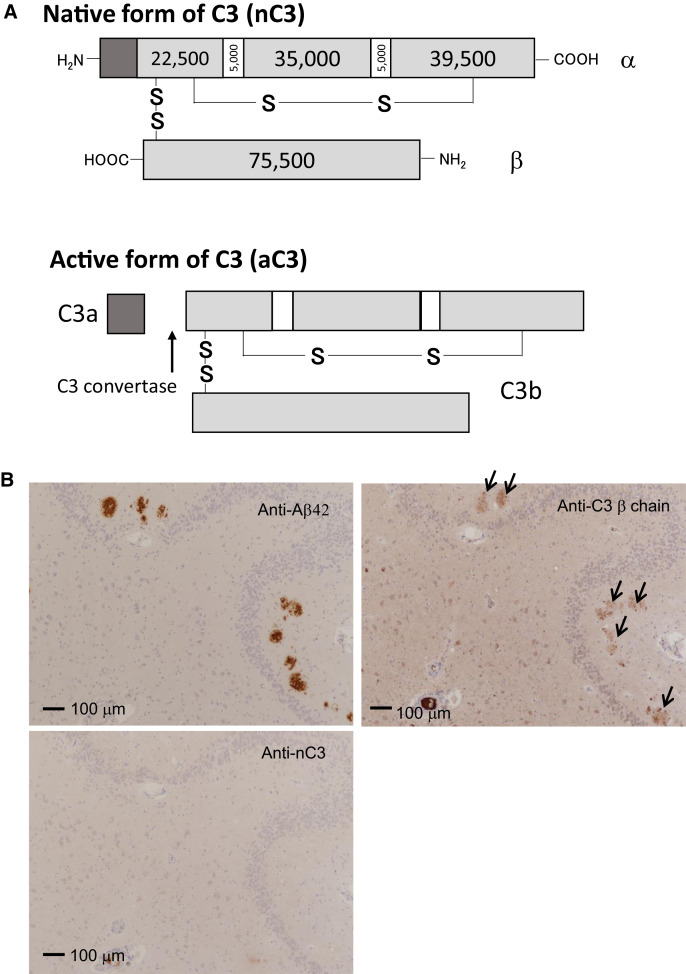
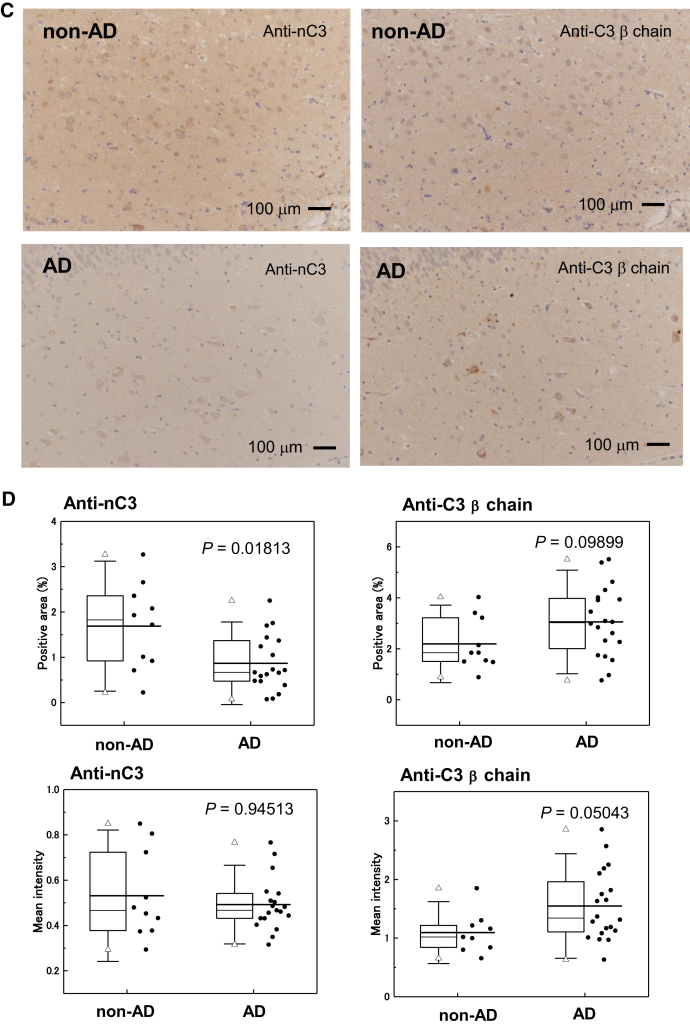
Fig. 3.
Expression of nC3 and aC3 in the hippocampal tissues from definite AD and non-AD patients. (A) Schematic representation of aC3 and nC3 forms. At the first step of C3 activation, the C3a fragment is produced by cleavage via C3 convertase. (B) Colocalization of the C3 fragment and Aβ42 in the AD hippocampus. Arrows indicate aC3 colocarized with senile plaque. (C) Demonstration of C3 activation in the AD hippocampus. (D) Analysis of nC3 and C3b levels in the brain tissues including the hippocampus from definite AD (n = 20) and non-AD (n = 9) patients. Abbreviations: aC3, active form of C3; nC3, native form of C3; AD, Alzheimer's disease.


