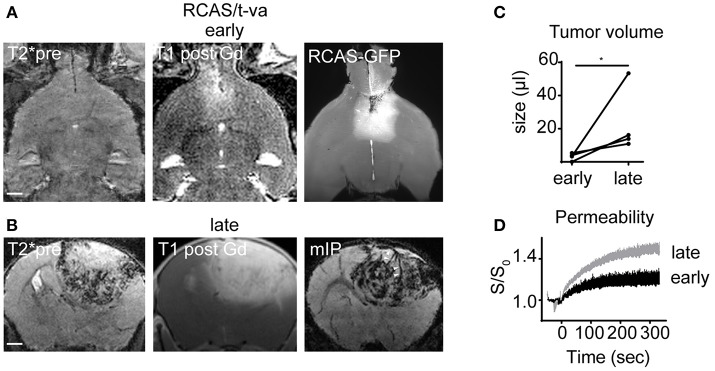
Figure 2.
MR-UM of RCAS/t-va tumors. Representative T2*, T1 post and ultramicroscopy image at an early tumor stage (n = 4 mice; A). Lower row shows T2*, T1 post and minimum intensity projection (mIP) at a late tumor stage (B). Quantification of tumor volume (C) and dynamic contrast enhanced imaging (D). Arrowheads in mIP indicate tumor vessels. Scale bars in (A,B) are 1 mm. *p < 0.05.

