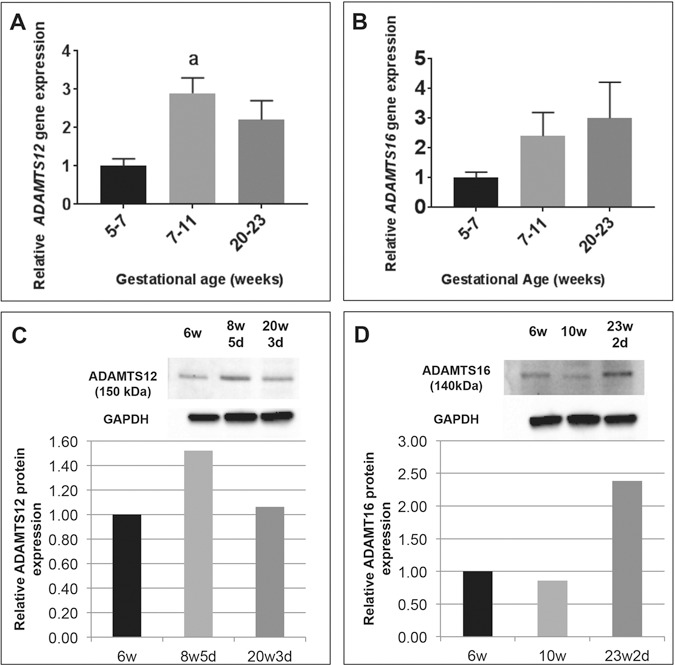
Figure 3.

Relative expression of ADAMTS12 and ADAMTS16 in first and second trimester of pregnancy compared to 5–7 weeks samples (black bars). (A) ADAMTS12 mRNA levels peak towards the end of the first trimester (7–11 weeks, light grey bars) and then decrease by the end of the second trimester (20–23 weeks, dark grey bars). (B) ADAMTS16 mRNA levels appear to increase through the first and second trimester of pregnancy. n = 5 in each group. aP ≤ 0.05. Data are expressed as mean ± SEM. (C) Western blot for ADAMTS12 on representative samples from each gestational age range (6 weeks, black bar; 8w5d, light grey bar; 20w3d, dark grey bar) shows similar expression patterns, quantified relative to 6-week sample. (D) Western blot for ADAMTS16 on representative samples from each gestational age range (6 weeks, black bar; 10 weeks, light grey bar; 23w2d, dark grey bar) shows similar expression patterns, quantified relative to 6-week sample.
