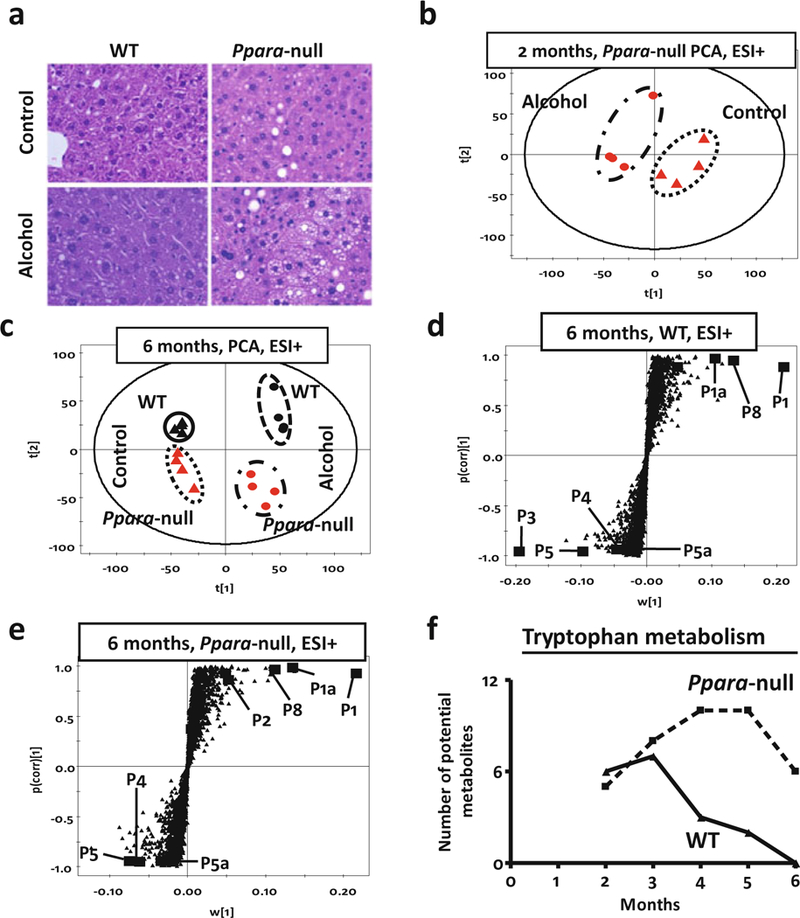
Fig. 2.

(a) Liver histology (HE stain) of wild-type (WT, left panel) and peroxisome proliferator- activated receptor alpha knockout (Ppara-null, right panel) mice after a duration of 1 month on control (upper panel) or 4 % alcohol-containing liquid diet (lower panel). Histology shows increased fat deposition in Ppara-null animals on the 4 % alcohol containing liquid diet. (b) Scores scatter plot from principal components analysis (PCA) showing unsupervised segregation of the urinary metabolome (ESI+ mode) from control and alcohol-treated Ppara-null mice at 2 months. (c) PCA scores scatter plot showing a larger difference between wild-type and Ppara-null metabolomic data as a result of chronic alcohol treatment (over 6 months). The triangles and dots indicate mice on control and alcoholic diet, respectively, with black and red color representing wild-type and Ppara-null mice, respectively. (d) Loading S-plots from the supervised orthogonal projection to latent structures (OPLS) analysis of ESI+ mode metabolic signatures (at 6 months) for candidate markers of chronic alcohol exposure in wild-type and (e) Ppara-null mice. Each triangle represents an ion characterized by unique mass and retention time. Representative candidates have been high- lighted (solid box) in the plots. A differential response was characterized by biomarkers that were exclusive to wild-type (P3) or Ppara-null (P2) mice. (f) MassTRIX analysis of putative metabolites related to tryptophan metabolism detected in ESI+ mode show variation over time during alcohol treatment. The solid and dotted lines represent wild-type and Ppara-null animals, respectively
