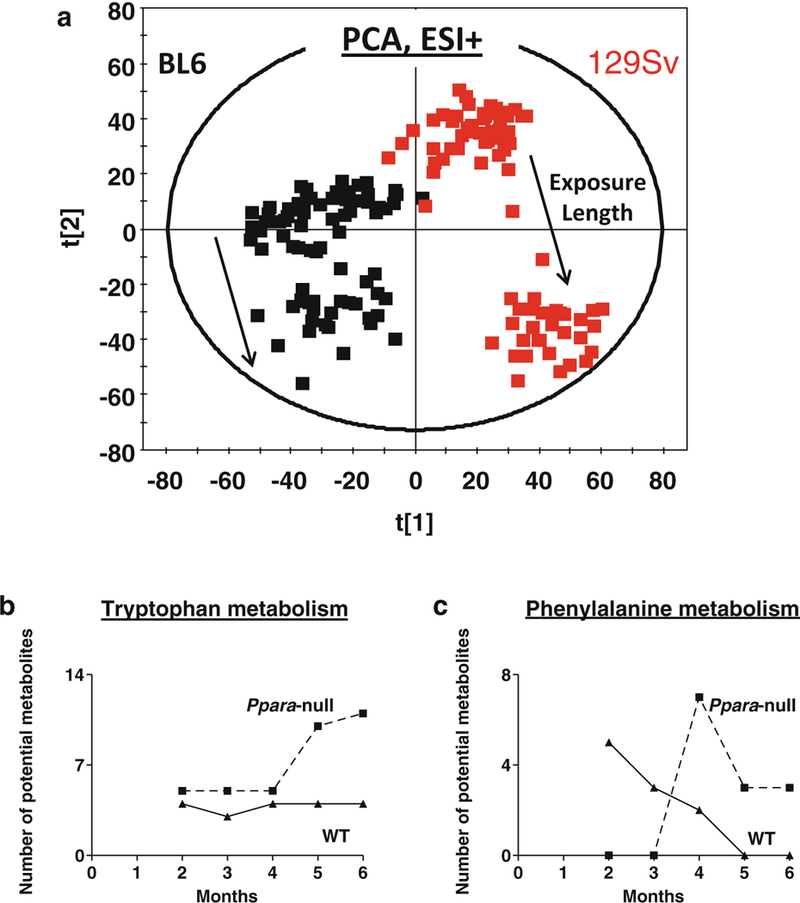
Fig. 4.

(a) PCA scores scatter plot showing mice on B6 (black) and 129/Sc (red) backgrounds possess distinct metabotypes associated throughout the study duration, irrespective of genotype and alcohol exposure. The solid arrows indicate the shift along second principal component over time due to alcohol exposure. MassTRIX analysis of putative metabolites related to (b) tryptophan and (c) phenylalanine metabolism detected in ESI+ mode show variation over time during alcohol treatment. The solid and dotted lines represent wild-type and Ppara-null animals, respectively
