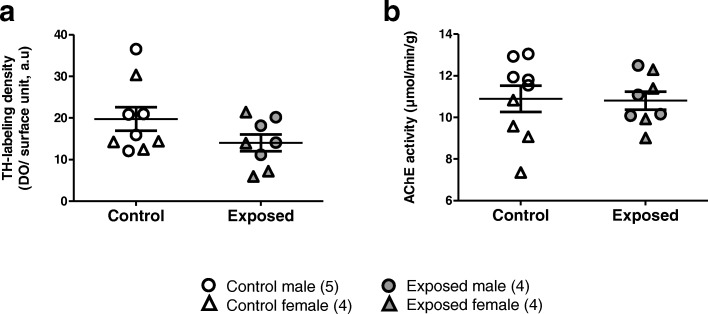
Fig. 4.
Quantification of dopaminergic and cholinergic inputs into GD28 olfactory tubercle. a Relative mean density of TH+ labeled fibers in the olfactory tubercle. The quantitative estimation did not show any significant difference between the two groups. b Relative means density of AChE activity in the olfactory tubercle. There was no significant difference between the two groups regarding the DE exposure. However, we observed a sex-dependent difference between the two groups, which interacted significantly with DE exposure

