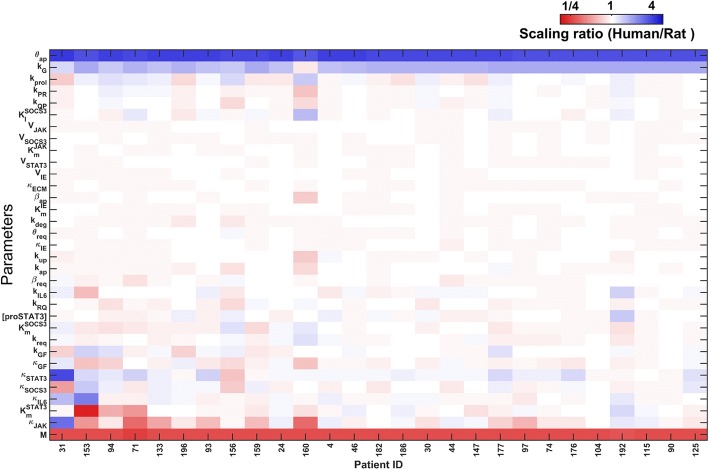
Fig. 2.
Heatmap of optimized model parameters scaled to that of rat parameters from Cook et al. [8]. The parameters metabolic load, cell death sensitivity and relative cell mass growth constant show significant difference across species, with relatively consistent scaling needed across all patients. Other parameters were more variable across patients and likely represent patient-specific liver cell-intrinsic differences

