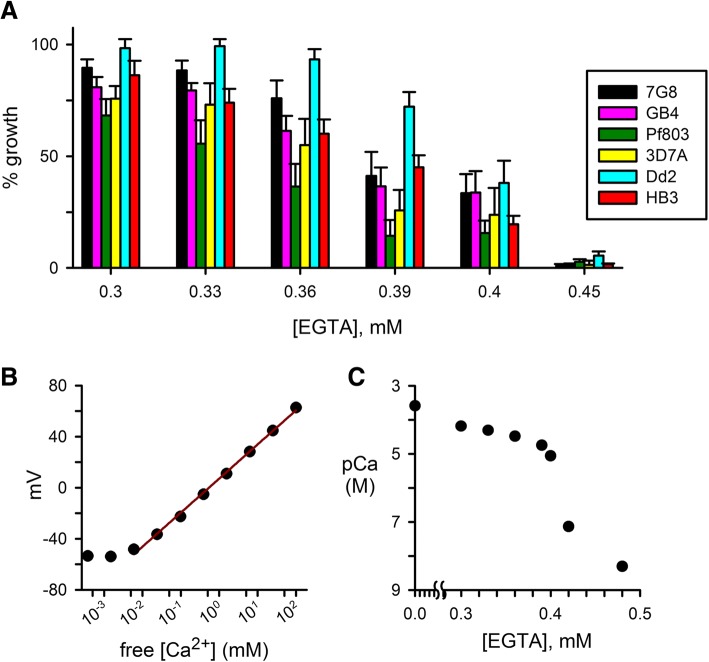
Fig. 1.
Differing Ca++ requirements for in vitro cultivation of common P. falciparum lines. a Mean ± S.E.M. growth of laboratory parasite lines in media supplemented with indicated EGTA concentrations, normalized to 100% growth for each parasite in media without EGTA. b Standard curve for free Ca++ measurements using ion-sensitive electrode. The solid line reflects a linear regression fit using data for Ca++ between 6 μM and 100 mM and corresponds to an electrode response of 26.7 mV/decade, in agreement with Nernstian predictions for a divalent cation. c Free Ca++ concentrations in culture media supplemented with indicated EGTA concentrations, measured using the Ca++-sensitive electrode and the standard curve in panel B. Free Ca++ is presented as pCa = −log([Ca++]) in moles/L. Note the marked and nonlinear reductions in free Ca++ concentrations with increasing EGTA. In panels B and C, symbols represent mean of replicate measurements with error bars typically smaller than the symbols

