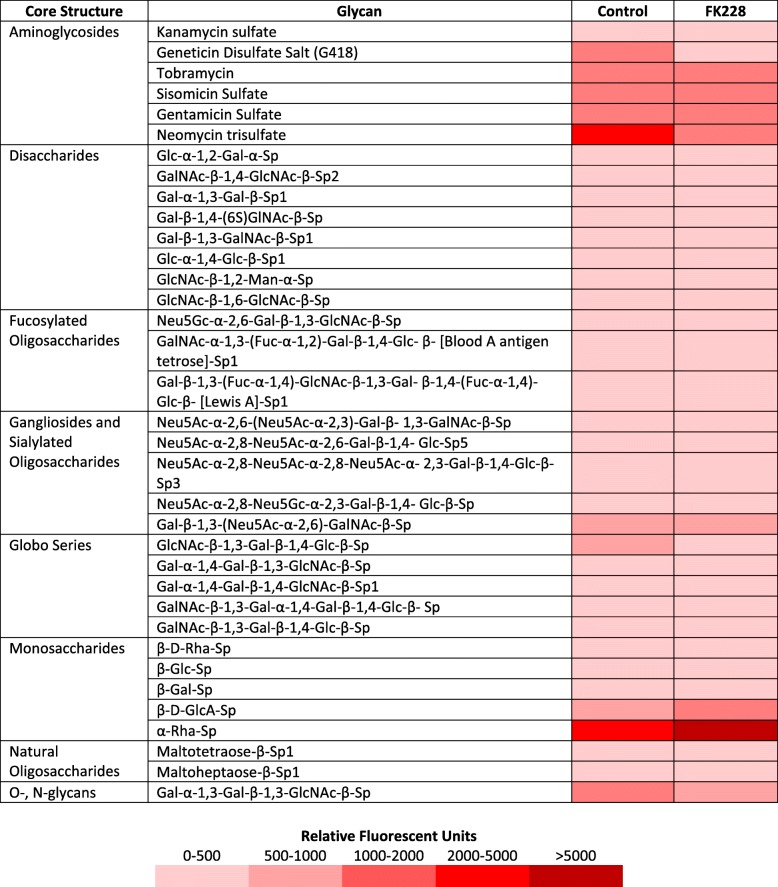
Table 4.
Comparison of glycan binding affinities between control and FK228 treated SW13 cells
Representative fluorescent signaling intensities summarizing the most intense glycan binding interactions for SW13 control cells and SW13 cells treated with 1 nM FK228 for 24 h. Fuc: L-Fuctose; Gal: D-Galactose; GalNac: N-Acetylgalactosamine; Glc: D-glucose; GlcNAc: N-Acetylglucosamine; Man: Mannose

