
Fig. 3.
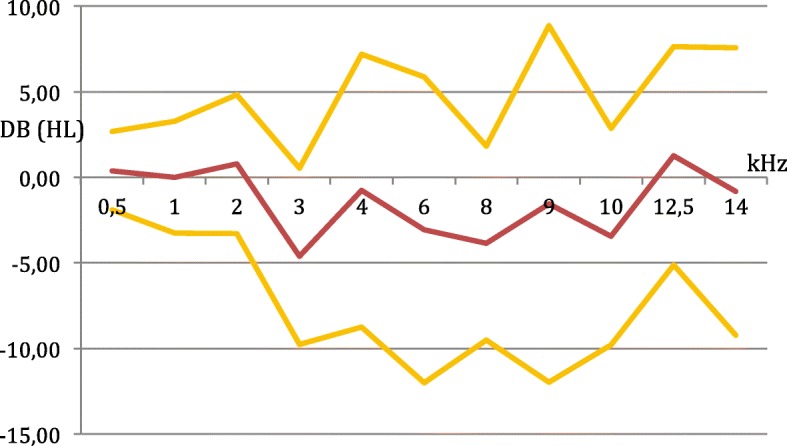
Difference of changes (final minus baseline) in mean air conduction hearing thresholds between treated and control ears: means and 95% confidence intervals at frequencies of 0.5 to 14 kHz
Official websites use .gov
A
.gov website belongs to an official
government organization in the United States.
Secure .gov websites use HTTPS
A lock (
) or https:// means you've safely
connected to the .gov website. Share sensitive
information only on official, secure websites.
Difference of changes (final minus baseline) in mean air conduction hearing thresholds between treated and control ears: means and 95% confidence intervals at frequencies of 0.5 to 14 kHz