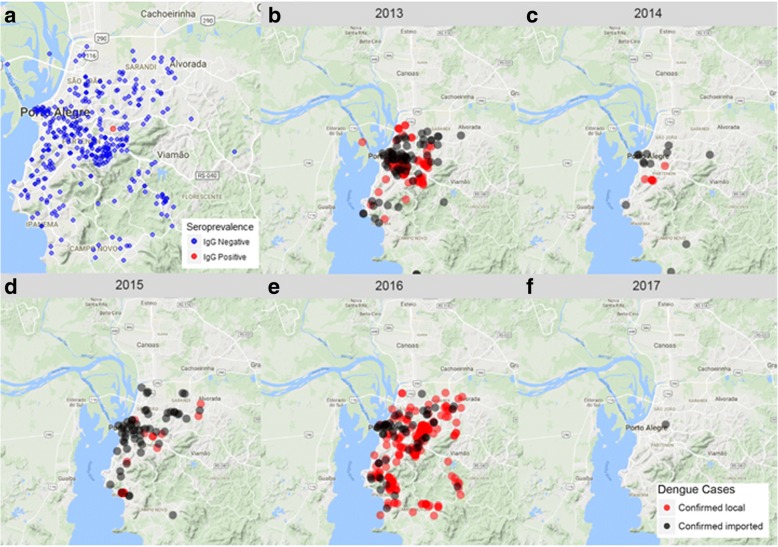
Fig. 2.
Historical dengue prevalence and incidence. a Dengue seroprevalence in 2015 (blue dots indicate distribution of samples collected and the red dot indicates the unique positive sample for previous dengue virus contact). b-f Geographical distribution of confirmed local (red) and imported (black) dengue cases in the city of Porto Alegre, from 2012 to 2017

