Fig. 4.
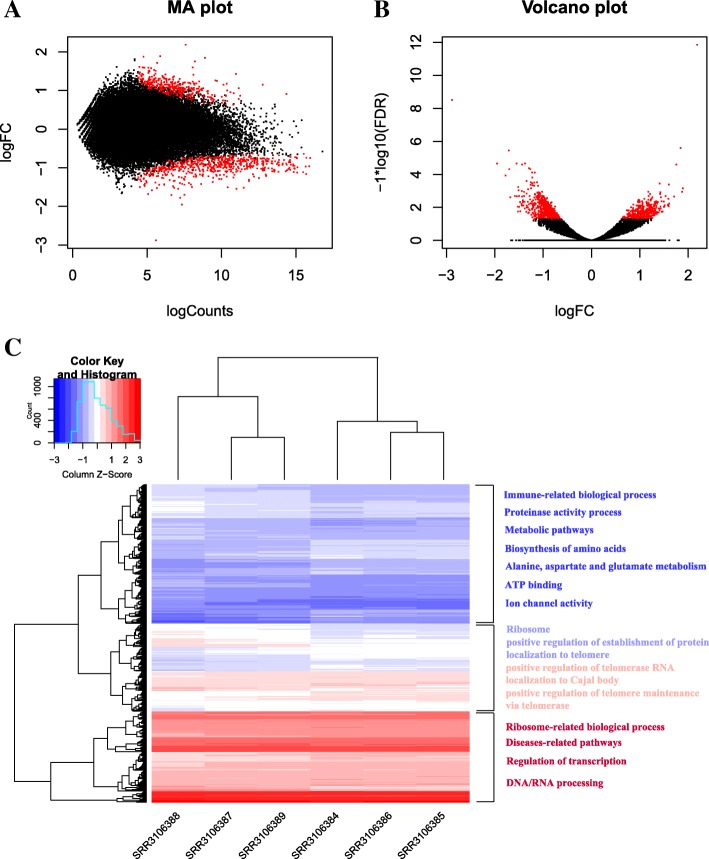
Differentially expressed transcripts identified during the comparison between control samples versus Symbiodinium-infected repeats at 4 h post infection. a MA plot for the transcriptome expression profiles of coral A. digitifera. b Volcano plot for the transcriptome expression profiles of coral A. digitifera, showing false discovery rate (-log10FDR) as a function of log2(fold change). The red dots represent the differentially expressed transcripts at adjusted P ≤ 0.05. c Heatmap of differential transcriptome expression profiles. The heatmap was visualized using R package gplots, all expression values were normalized using Z-score, and the differentially expressed transcripts were initially clustered using average linkage clustering

