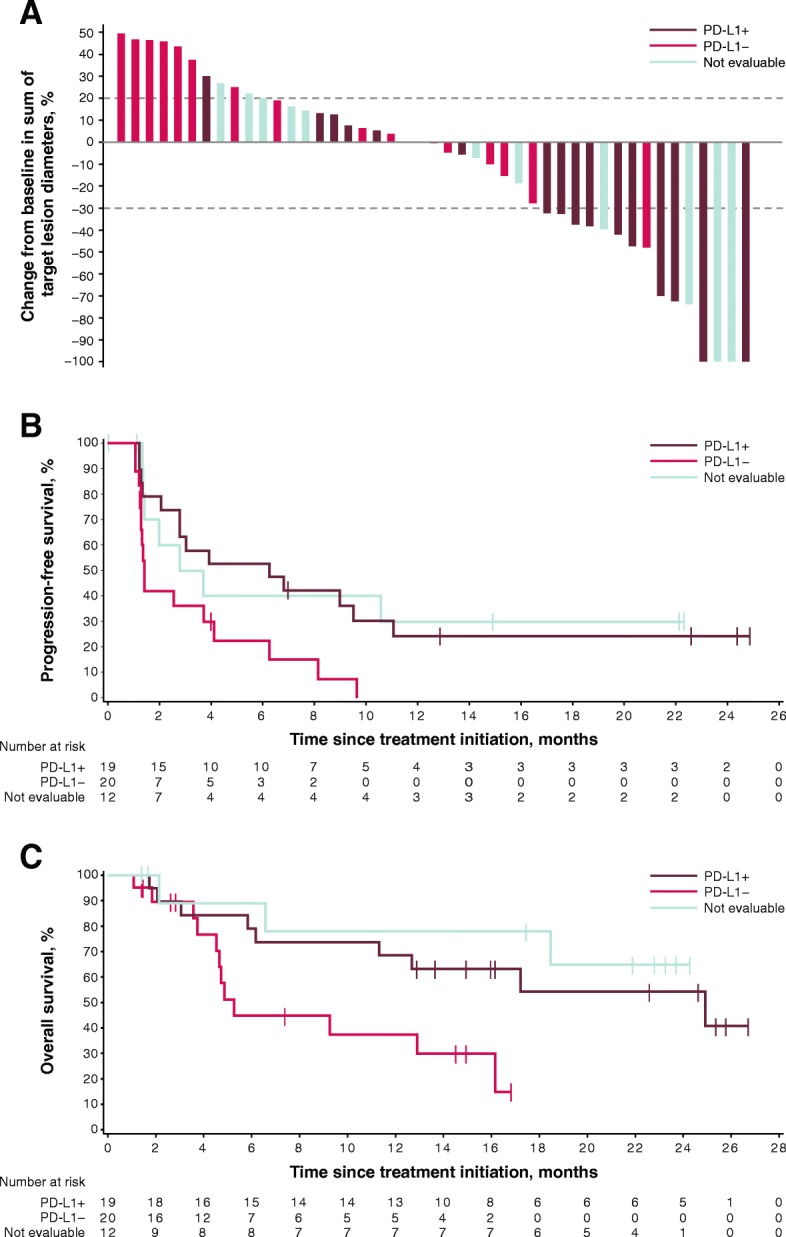
Fig. 4.

Best change in sum of target lesion diameters from baseline (a), and PFS (b) and OS (c) according to tumor PD-L1 expression status at 1% cutoff in evaluable patients

Best change in sum of target lesion diameters from baseline (a), and PFS (b) and OS (c) according to tumor PD-L1 expression status at 1% cutoff in evaluable patients