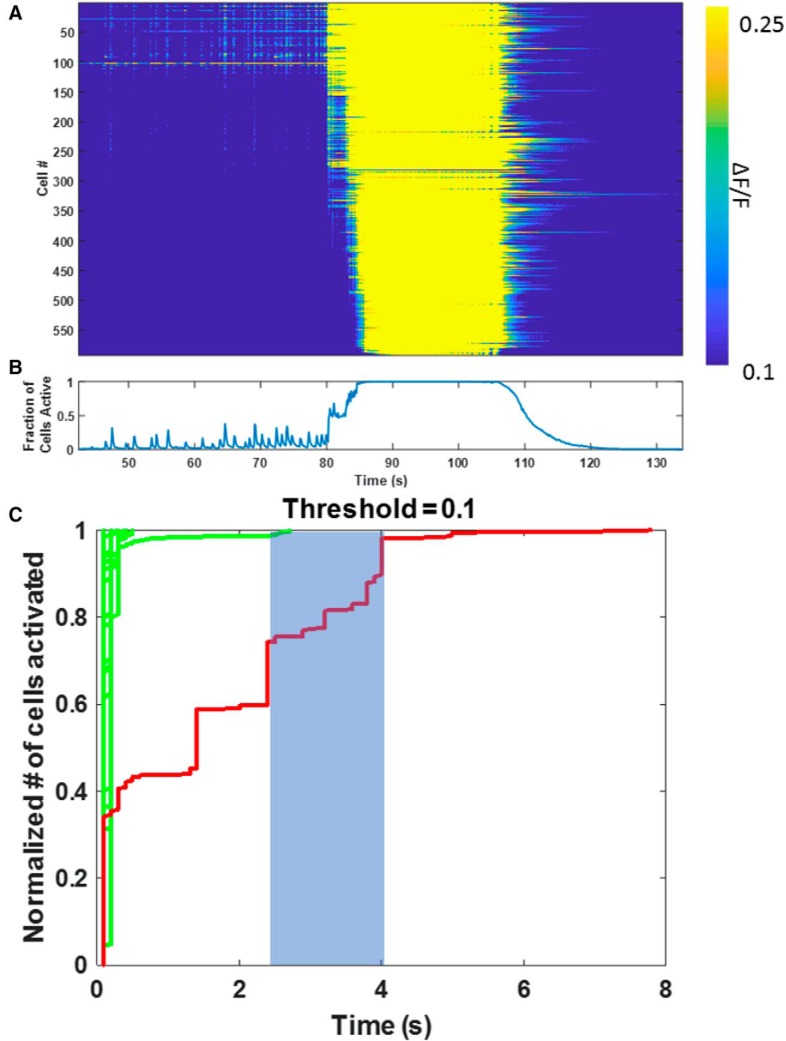
Figure 12.
Rate of propagation of ictal versus interical activity: calcium imaging. A, Raster plots of the time at which neurons activated during spikes and a seizure. A total of 600 neurons were imaged using GCaMP7b and arranged in the raster plot according to the time at which they activated (crossed a threshold of 10% ΔF/F) during the onset of the spontaneous seizure beginning at 80 s into the recording. B, Network average of neuronal calcium signals. C, Raster plots of sequential interictal spikes and seizure shown in A and B, arranged according to time of increase in calcium during each individual event. Red represents seizure. Green represents spikes. Initial rates of activation are similar for spikes and seizures. However, the rate at which activity propagates after the initial activation is much slower for both the seizure and the nonpropagated spike activity, consistent with the modeling shown in Figure 7.

