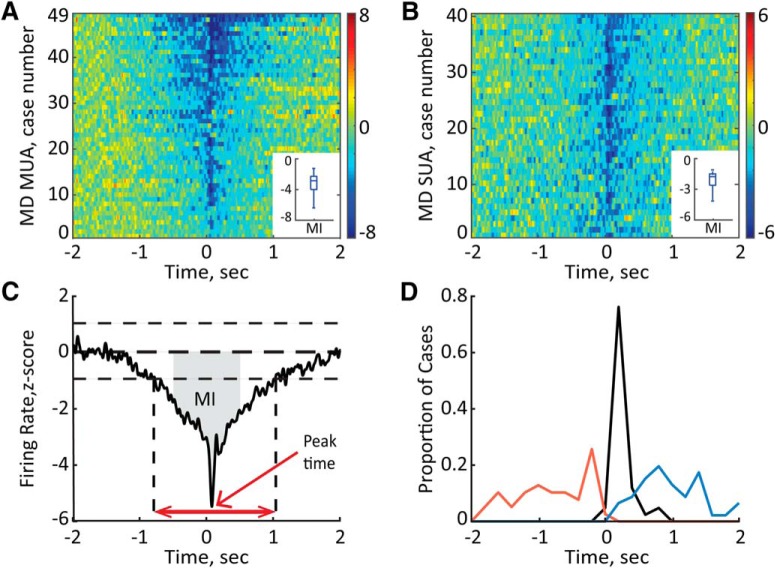
Figure 3.
Ripple-associated suppression of the MD neural activity. A, B, Normalized firing rate is plotted for MD MUA (A) and MD single units (B). The averages around onsets of all detected ripples are shown for 49 MD MUA recordings obtained from different MD sites in eight rats and 40 single units (n = 6 rats). The cases are sorted according to the values of the MI. Color bars show z scores. Insets, Median and variability outside the upper and lower quartiles are indicated. C, Quantitative characterization of the ripple-associated firing rate change. The MI was calculated as the area (gray) between the curve and y = 0 within ±0.5 s around the ripple onset (t = 0). The onset and offset of modulation were detected by ±1 SD threshold crossings (vertical dashed lines). The time between onset and offset was considered the duration of modulation (red double-headed arrow). The peak time was determined as the time with the minimum firing rate (red arrow) D, The distribution of onsets (red), peak times (black), and offsets (blue) of the MD firing rate change relative to ripple onset (t = 0) for all MD MUA cases (n = 49) shown in A.

