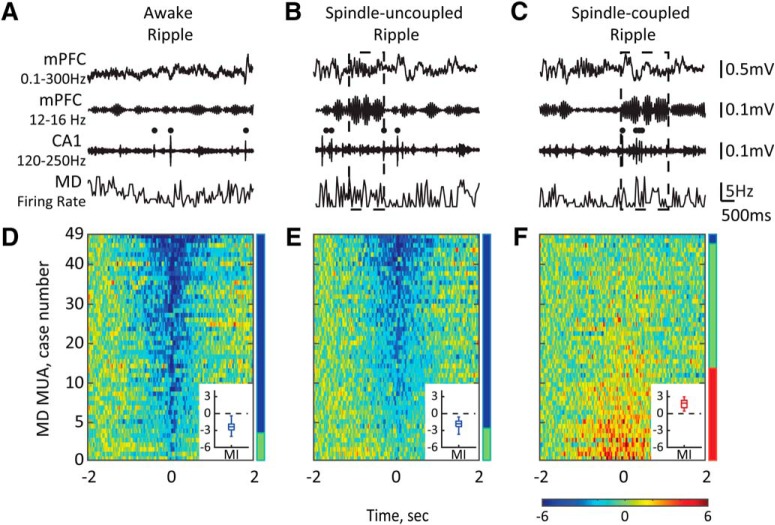
Figure 7.
The MD activity is not suppressed around ripples co-occurring with sleep spindles. A–C, Top traces show the broad-band-filtered (0.1–300 Hz) and bandpass-filtered (12–16 Hz) LFPs recorded from the mPFC and the bandpass-filtered (120–250 Hz) LFPs recorded from the CA1 subfield of the dHPC during awake state (left) and NREM sleep (middle, right). Bottom traces show the corresponding MD firing rates. Black dots mark ripples, dashed-lined rectangles mark sleep spindles. D–F, Normalized firing rates of all MD MUA cases are plotted around ripple onset and sorted according to the MI value. The horizontal color bar shows z scores. Vertical color bars show the proportions of MD cases with significant decrease (blue), increase (red), or no change (green) in the firing rate. Insets, Box plots show the MIs distribution across MD MUA cases with significant firing rate modulation. Note that during NREM sleep, ripples may (right) or may not (middle) coincide with sleep spindles, and that periripple MD modulation depends on the ripple/spindle coupling.

