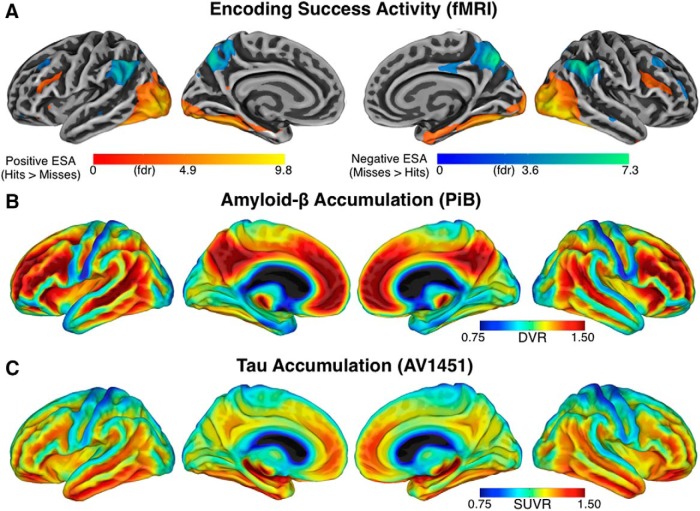
Figure 1.
Whole-brain maps illustrating the colocalization of fMRI activity, amyloid-β, and tau accumulation. A, Task-evoked fMRI activity across all participants on the cortical surface (p < 0.05, FDR-corrected). Warm colors show positive encoding success activity, cool colors show negative encoding success activity. B, The mean amyloid-β accumulation using PET-PiB expressed as DVR across all participants. The red colors indicate areas with high levels of accumulation and blue with low. C, The mean tau accumulation, using PET-AV1451 expressed and SUVR across the subset with tau data.

