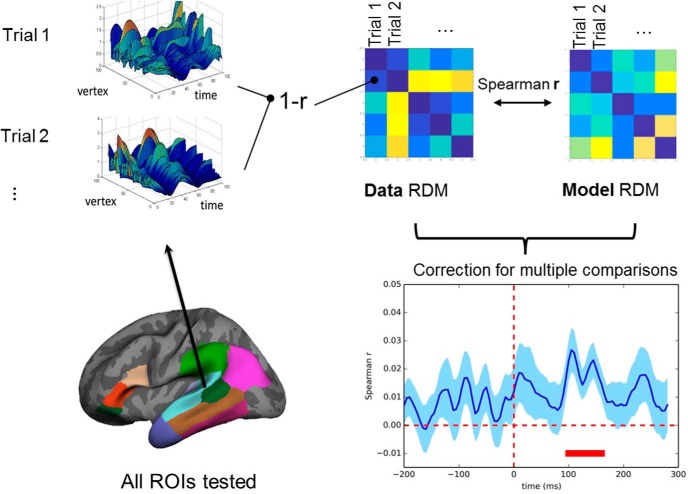
Figure 1.
Schematic overview of RSA multivariate analysis procedures. (1) RDMs are derived for each ROI and each subject across the length of the analysis epoch. These data RDMs summarize the differences between the activation patterns (1 − r) between trials in a given time window (20 ms in width) every 5 ms across all vertices of a given ROI. (2) Each data RDM is compared with model RDMs (Spearman r), derived separately for each cognitive measure. To produce group-level statistics, a one-sample t test is taken for each ROI and each time point across subjects. The resulting t maps were thresholded at the p < 0.01 level. To correct for multiple comparisons, values surviving the primary threshold were entered into a cluster-permutation analysis (1000 permutations) (Maris and Oostenveld, 2007; Su et al., 2012). Only clusters that survived the p < 0.05 cluster-correction threshold are reported (red bar).

