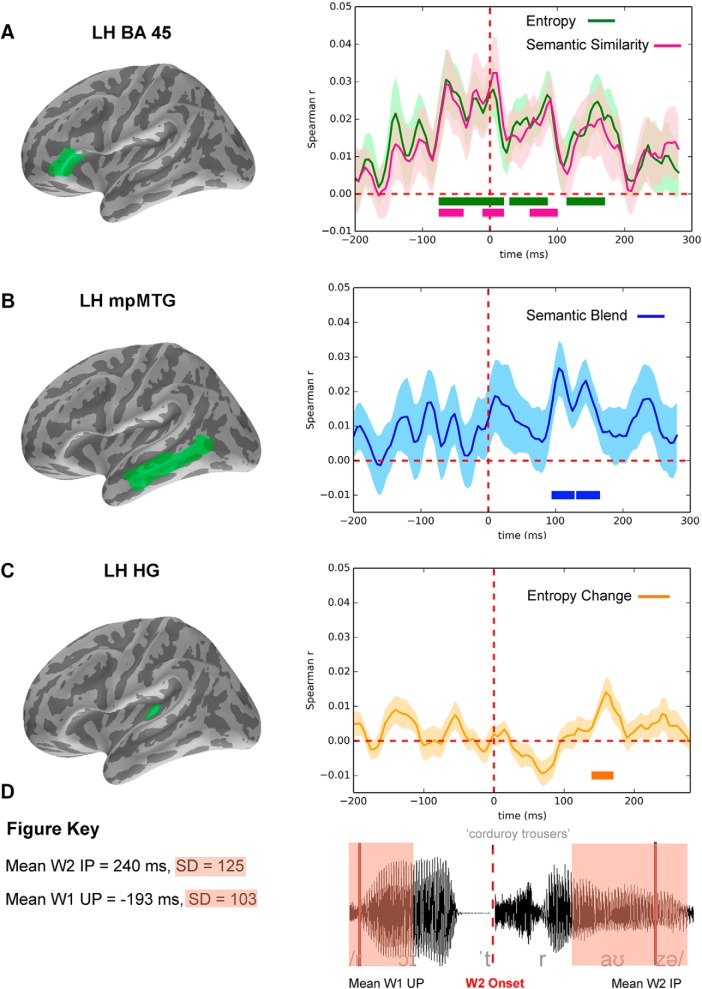
Figure 2.
Spatiotemporal coordinates of RSA model fits for the W1 modifier-based constraints. A–C, Left, The ROIs (in green on the inflated MNE brain) producing significant model fit for the four models. A, Right, Subject-averaged model fit r value in left BA45 across the analysis epoch (−200 ms to 300 ms relative to W2 onset) for the Entropy (green) and the Semantic Similarity (pink) models. B, Semantic Blend (blue) model fit in left middle and posterior MTG. C, Entropy Change (orange) model fit in left HG. Shaded areas represent the SE of the model-fit means. Thick lines below the r curves indicate the significant t value model-fit clusters (corrected for multiple comparisons at p < 0.05). Vertical broken red line indicates W2 onset. D, Left, Key specifying the mean and SD of the critical time points overlaid (right) on the auditory waveform of a sample test phrase.

