Figure 3.
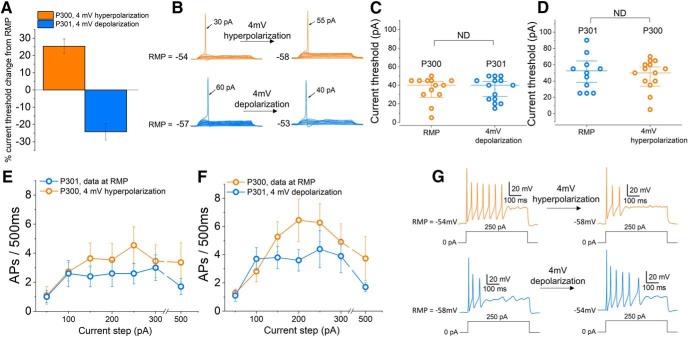
Firing properties of iPSC-SNs from subjects P300 and P301 are not significantly different at matched membrane potentials. A, Graph showing the percentage change in current threshold after depolarizing (P301, n = 10; blue) or hyperpolarizing (P300, n = 12; orange) the RMP of iPSC-SNs by 4 mV (the average difference in RMP between P300 and P301). B, Example recordings from neurons derived from P300 (orange) and P301 (blue) showing the change in current threshold after either depolarizing (P301) or hyperpolarizing (P300) the RMP of iPSC-SNs by 4 mV. C, Scatter plot showing individual current threshold values for iPSC-SNs from P300 (orange) at RMP and P301 (blue) depolarized by 4 mV. D, Scatter plot showing individual current threshold values for iPSC-SNs from P301 (blue) at RMP and P300 (orange) hyperpolarized by 4 mV. E, Input–output relationships for iPSC-SNs from P300 and P301 at matched membrane potentials (obtained by hyperpolarizing P300 neurons by 4 mV). F, Input–output relationships for iPSC-SNs at matched membrane potentials (obtained by depolarizing P301 neurons by 4 mV). G, Example recordings from a neuron derived from P300 (orange) and P301 (blue) showing the change in firing frequency after either depolarizing (P301) or hyperpolarizing (P300) the RMP by 4 mV.

